


The saying “An ounce of prevention is worth a pound of cure” is ever so true when it comes to SQL Server security. Even if everything seems fine with your SQL Server environment from a security standpoint (i.e. no unexpected slowdowns or increased network traffic; none of the data or the objects are damaged corrupted or missing), as we’ve outlined in several articles before, having an auditing system up and running can be literally a life savior when it comes to any suspicious activities, such as unauthorized permission changes or compromised SQL logins. So, how can one set up SQL Server auditing?
The out-of-the box auditing solution
Provided that you use the Enterprise edition of SQL Server 2008 or above you can configure the auditing functionalities which come built in with the SQL Server itself. This approach is very straightforward to set up, has minimal impact on the server resources and can be configured to be pretty granular which is fitting for scenarios where you only want to track access to sensitive tables or actions made by a certain group of users.
However, it comes with a couple of downsides as well. For starters, it is instance based, meaning that there is no easy way to Audit SQL Server on all the SQL Server instances in your organization from a centralized location. Furthermore, audit data is stored either in a file, or as part of the operating system’s event logs. If you want to be able to analyze and report on this data, you will have to manually import it into your own database. In addition, data archiving or pruning needs to be done manually. This mechanism of storing audit data isn’t the best from a security perspective either. Namely, if an attacker gains elevated privileges over the machine hosting the SQL instance, the captured data can be destroyed quite easily. Finally, built-in auditing doesn’t come with built-in reporting. Therefore, you would need to create your own reports in order to make the captured data more readable. Of course, the biggest downside is that unless you have the Enterprise edition of SQL Server 2008 or above, you won’t be able to use this feature fully – or at all.
Auditing through tracing
Another approach is to leverage the default trace which was introduced in SQL Server 2005. As it was designed to capture all of the events that have occurred on the SQL instance, that information can be used for auditing purposes as well – particularly since the name of the application and the host that were used to execute the action are captured as well. For instance, using the default trace you can determine which users have been dropped, by executing:
SELECT
       TE.name AS EventName ,
       v.subclass_name ,
       T.DatabaseName ,
       t.DatabaseID ,
       t.NTDomainName ,
       t.ApplicationName ,
       t.LoginName ,
       t.SPID ,
       t.StartTime ,
       t.RoleName ,
       t.TargetUserName ,
       t.TargetLoginName ,
       t.SessionLoginName
  FROM
       sys.fn_trace_gettable(CONVERT(varchar(150),
                  (SELECT TOP 1 f.[value]
                   FROM sys.fn_trace_getinfo(NULL)f
                   WHERE f.property = 2)), DEFAULT)T
       JOIN sys.trace_events TE
       ON
       T.EventClass
       =
       TE.trace_event_id
       JOIN sys.trace_subclass_values v
       ON
       v.trace_event_id
       =
       TE.trace_event_id
   AND
       v.subclass_value
       =
       t.EventSubClass
WHERE
        te.name IN ( 'Audit Addlogin Event', 'Audit Add DB User Event',
        'Audit Add Member to DB Role Event' )
    AND v.subclass_name IN ( 'Drop', 'Revoke database access' );
The caveats of this approach are that it’s more performance intensive than built-in SQL auditing, and it suffers from the same downsides – particularly the way it stores captured data. Similarly to the built-in auditing, the trace results are saved in five .trc files. The maximum size of each trace file is 1 GB and when a file is filled up a rollover is performed to the next one. The problems that this approach can cause, especially on a busy server, are quite evident. Since the trace stops once the files are full, you will be exposed to losing valuable information. Of course, this limitation can be bypassed programmatically, but the fact remains that even in that case you will constantly need to keep an eye on your disk space and the trace files themselves can easily be located and destroyed by a malicious attacker.
Another way to access information on the changes that have occurred on your database is to examine its transaction log. Since each database change is recorded in the online transaction log, this way there is no risk of losing valuable info and the audit data gathered that way is fully reliable due to the design of the transaction log itself. Finally, unlike the approaches listed above, the transaction log holds information on the changes made before any auditing system was set in place. However, the downside to this approach is that the transaction log was never intended to be humanly readable. This is where a transaction log reader, like ApexSQL Log can help.
ApexSQL Log is an auditing and recovery tool for SQL Server databases which reads transaction logs, transaction log backups, detached transaction logs and database backups, and audits, reverts or replays data and object changes that have affected the database, including the ones that have occurred before the product was installed.
To determine the security changes that have occurred on your database using ApexSQL Log
- Start ApexSQL Log
- Specify the name of the SQL instance where the database whose transaction log you want to examine resides
- Specify the authentication type for the aforementioned SQL instance; please note, if SQL authentication is selected a valid SQL login name and password need to be provided
-
Select the database whose online log will be examined and click Next
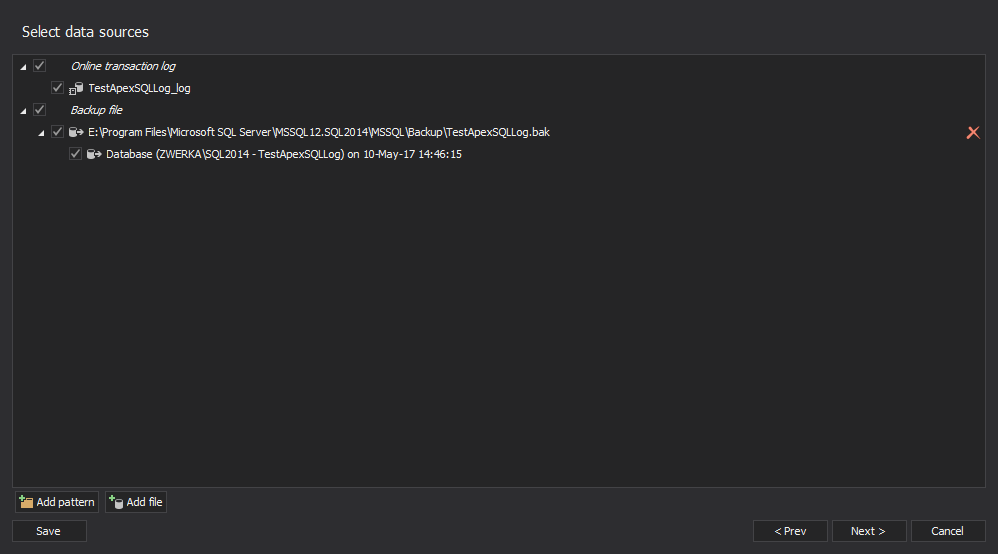
If you have any transaction log backups or detached transaction logs of the SQL database, click on the Add button, select appropriate files and click the Next button to advance
-
Next, opt for the Open results in grid options
-
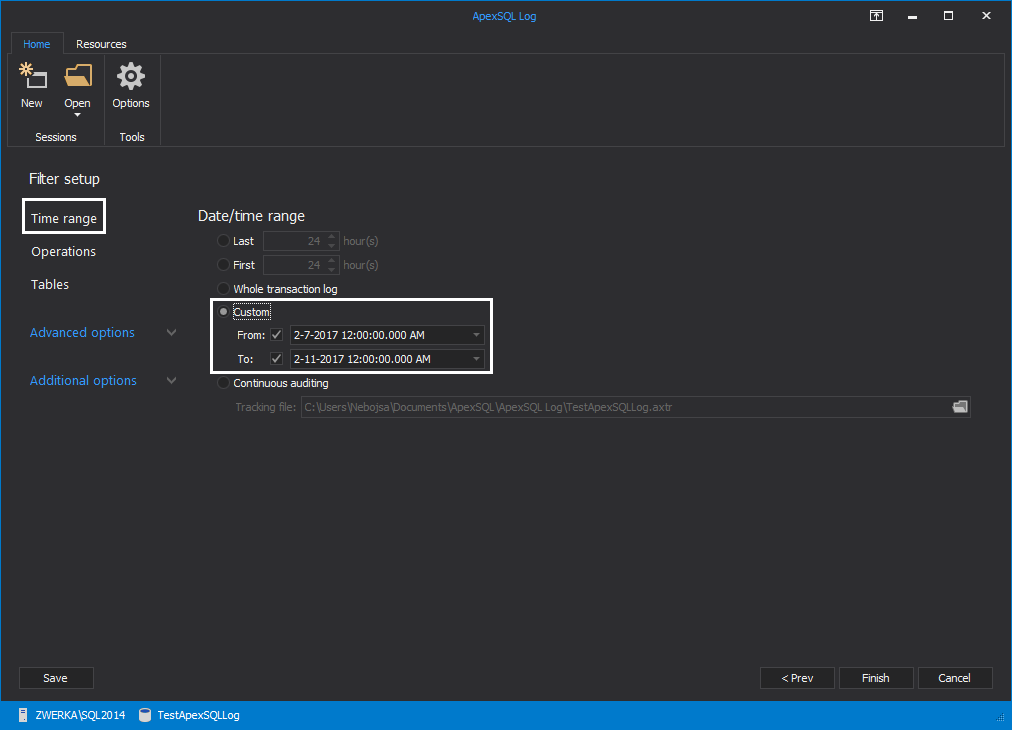
In the Filter setup step of the wizard use various filters to specify the subset of auditing results to be displayed. You can filter the results by time period, the affected objects, the logins, applications and host names used to make the changes – or by the type of the change that was made
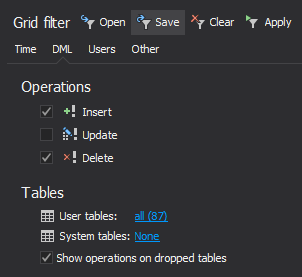
All of the database changes that meet the criteria you’ve specified, including information on the login, application and host used to make then will be listed in the application’s main grid. To narrow down these results, use the Grid filter in the left pane
To sum things up, there are several different approaches you can utilize to keep on top of the security changes in your SQL environments. Depending or your needs, as well as the scope of events you want to audit you can use the built-in SQL Server auditing, if available on your edition of SQL Server, or the default trace. However, due to the architecture of the SQL Server itself, the most reliable audit approach, is to examine the online transaction log directly, and ApexSQL Log is the tool which will help you get the job done.
Downloads
Please download the script(s) associated with this article on our GitHub repository.
Please contact us for any problems or questions with the scripts.
April 26, 2013


