


In the previous part of this series, we showed how to use SQL Server profiler to create a SQL trace that provides enough information to find expensive SQL queries. In this part, we will show how to create a SQL trace without SQL Profiler and how to analyze the information captured.
How to create a SQL trace using T-SQL statements
Besides using SQL Server Profiler and its GUI, a SQL trace can be created using T-SQL statements.
- Create a SQL trace using the sp_trace_create stored procedure
DECLARE @new_trace_id INT;

EXECUTE master.dbo.sp_trace_create
  @trace_id = @new_trace_id OUTPUT,
  @options = 0,
  @tracefile = N'D:\Test\LongQuery.trc'
- Add events to the SQL trace using the sp_trace_setevent stored procedure. Be careful here, as you have to execute the stored procedure for each event you want to add to the trace. The events and columns are added using their IDs. The syntax is the following:
EXECUTE sp_trace_setevent trace_id, event_id, column_id, 1
For example, to add the SP:Completed event to the trace where the ID is equal to 1, with the columns TextData, ApplicationName, LoginName, and Duration, you have to execute the following four statements:
EXECUTE sp_trace_setevent 1, 43, 1, 1
EXECUTE sp_trace_setevent 1, 43, 10, 1
EXECUTE sp_trace_setevent 1, 43, 11, 1
EXECUTE sp_trace_setevent 1, 43, 13, 1
The SP:Completed event ID is 43, and 1, 10, 11, and 13 are column IDs for the listed columns, respectively.
-
Add filters, if needed, using the sp_trace_setfilter stored procedure.
To add a filter to the DatabaseName column (column_id = 35), the same as in the GUI example given earlier, execute the following statements:
EXECUTE sp_trace_setfilter 1, 35, 0, 7, N'QueryCost'
EXECUTE sp_trace_setfilter 1, 35, 0, 7, N'Collection'
Instead of writing T-SQL code to create a SQL trace, you can create code for a SQL trace using SQL Server Profiler:
- Create a SQL trace using SQL Server Profiler, as described in Monitor SQL Server queries – find poor performers – SQL Server Profiler
-
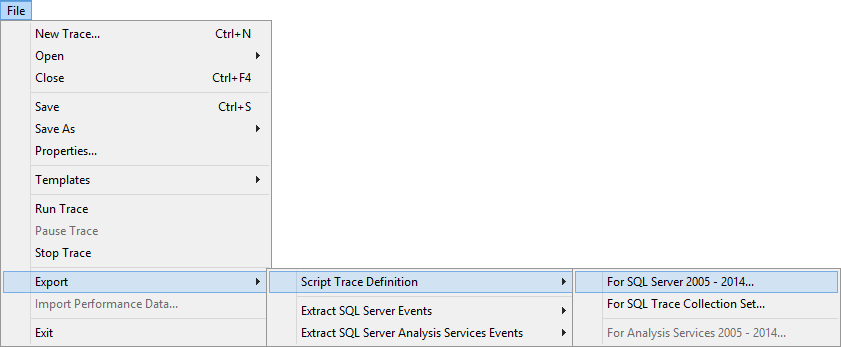
On the menu, select File, then Export | Script Trace Definition | For SQL Server 2005 – 2014
-
Specify the location to save the SQL file.
The file contains the statements given in the previous section. When executed, the file creates a SQL trace with the same settings as set in SQL Server Profiler.
Although these SQL traces are identical, the SQL trace created using T-SQL adds less overhead than the one that uses GUI.
How to analyze the data
For a general query analysis, it’s recommended to run a trace during a period when the SQL Server instance you want to audit is in normal activity. There is no strict rule how long this time period should be, however you might get an inaccurate picture if you run a trace for a short period.
If you want to analyze specific queries, start the trace before these queries are executed and stop it after they are completed. Make sure you don’t leave SQL traces running more than needed, as they can add overhead. If you don’t plan to stop the trace manually, use the Enable trace stop time option when configuring the trace.
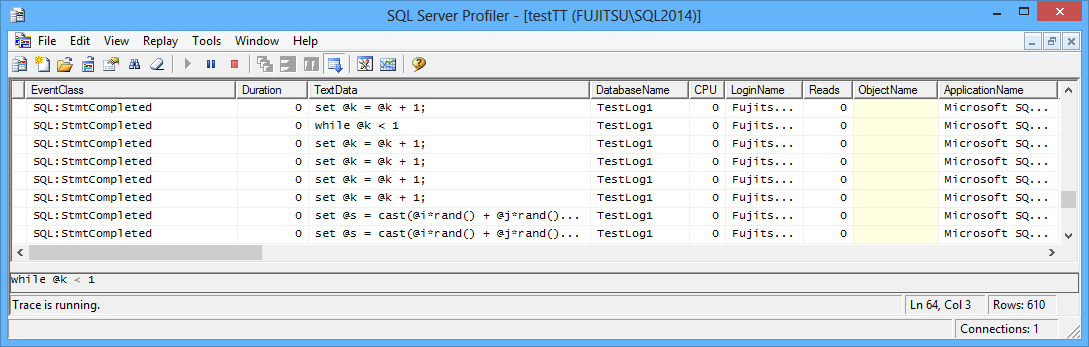
When using SQL Server profiler, whether you selected to save the trace or not, the events will be shown in the SQL Server Profiler window. This presentation is not convenient for any deeper analysis, as the events are numerous, repeated events are not grouped, and no grouping and filtering is possible.
For example, for events in a loop, each statement is shown separately:
BEGIN
	SET @s = cast(@i*rand() + @j*rand() + @k*rand() AS varchar(4000));
	INSERT INTO TestTable (f2, f3, f4)
	VALUES (@j, @k, @s);
	SET @k = @k + 1;
END;
The events are also repeated when saved in a file or a table, but ordering, grouping, and filtering there is possible.
When the events are saved in a trc file, you can import them into a table later using the following statement:
SELECT * INTO Trace
FROM ::fn_trace_gettable('D:\Test\trace123.trc', default)
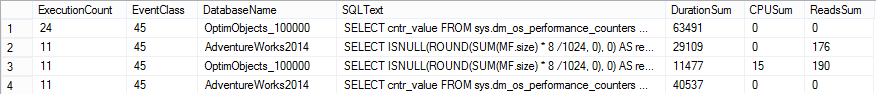
Note that the Trace table will be created automatically, you don’t have to create it in advance. When the event information is in a SQL table, you can aggregate, query, and analyze the events using T-SQL statements. As the TextData column is of ntext data type that cannot be used he in the GROUP BY statement, we will cast it as nvarchar.
SELECT COUNT(*) AS ExecutionCount, EventClass, DatabaseName, CAST(TextData AS nvarchar(2000)) AS SQLText, SUM(Duration) AS DurationSum, SUM(CPU) AS CPUSum, SUM(Reads) AS ReadsSum
FROM Trace
GROUP BY EventClass, CAST(TextData AS nvarchar(2000)), DatabaseName
ORDER BY ExecutionCount DESC
While the events in SQL Server Profiler window are shown with their names, in trc files and trace tables they are shown with their IDs.
The results shown depend on the events and columns we selected for the trace. There is no right set of events and columns, as it depends on the environment, databases, and DBA’s requirements and preferences. If you used proper filters, the result set will contain only the information you need for analysis. If you have many useless events captured, check your filters and modify them.
It’s not only important to know how long a query was running and optimize its execution. Equally important is to see how many times it was executed, as frequent executions of the same query also need analysis and optimization.
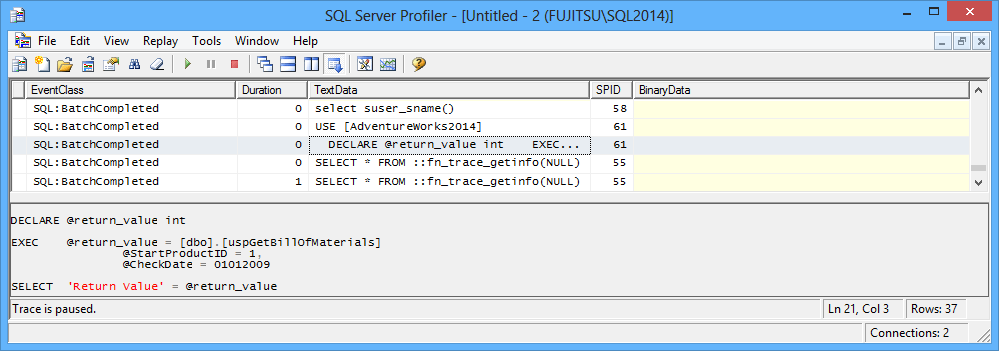
When you execute a stored procedure, using code such as:
USE [AdventureWorks2014]
GO

DECLARE	@return_value int

EXEC	@return_value = [dbo].[uspGetBillOfMaterials]
		@StartProductID = 1,
		@CheckDate = N'2009/01/01'

SELECT	'Return Value' = @return_value

GO
The trace will not show the uspGetBillOfMaterials stored procedure statements, but only the EXEC statement with the stored procedure name and parameters used. The same goes for functions. For further analysis, you have to get stored procedure code manually.
For servers with small load and queries quickly executed, the duration time can be zero.
Resources:
SQL Server Event Class Reference
Create a Trace (Transact-SQL)
sp_trace_setevent (Transact-SQL)
October 6, 2014


