


In the previous parts of this series, we described how to find the most expensive recent queries using SQL Server Management Studio native features and dynamic management views and functions. In this part, we will show how to do that using SQL Server Profiler.
SQL Server Profiler is a feature available in the Enterprise, Business Intelligence, and Standard editions of SQL Server. It provides a graphical user interface to create, manage, analyze, and replay SQL traces. SQL traces collect information about SQL Server events, which can be used for SQL Server auditing, as well as monitoring and troubleshooting SQL Server performance. SQL Server Profiler provides several SQL trace templates that you can use out of the box to start collecting event information. Another way to create SQL traces is to use T-SQL stored procedures.
Note however that Microsoft has announced that SQL traces will be depreciated in future releases of SQL Server, and using Extended Events instead is recommended.
How create a SQL trace using SQL Server Profiler
To be able to run SQL Server Profiler, the login must have the ALTER TRACE permission.
- Start SQL Server Profiler from the SQL Server Management Studio Tools menu, or from the Windows Start menu: Programs |Microsoft SQL Server 2014 | Performance Tools
-
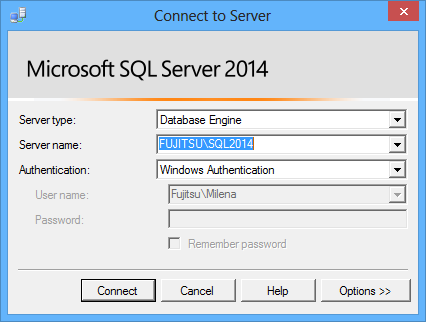
Connect to the SQL Server instance and provide credentials
-
When selecting the events and columns to trace, keep in mind that collecting too many events and columns will degrade SQL Server performance. Also, it will add noise to the captured events. Therefore, it’s highly recommended to capture only the events and columns you need for analysis. Selecting the proper set of events and columns depends on what you want to audit and your personal preferences.
SQL Server Profiler provides several built-in templates where tracked events and columns for each event are defined. Whatever template you select, you can modify the events and columns captured.
In this example, we’ll select TSQL_Duration from the templates drop-down list and modify it. This template provides basic information for query duration analysis.
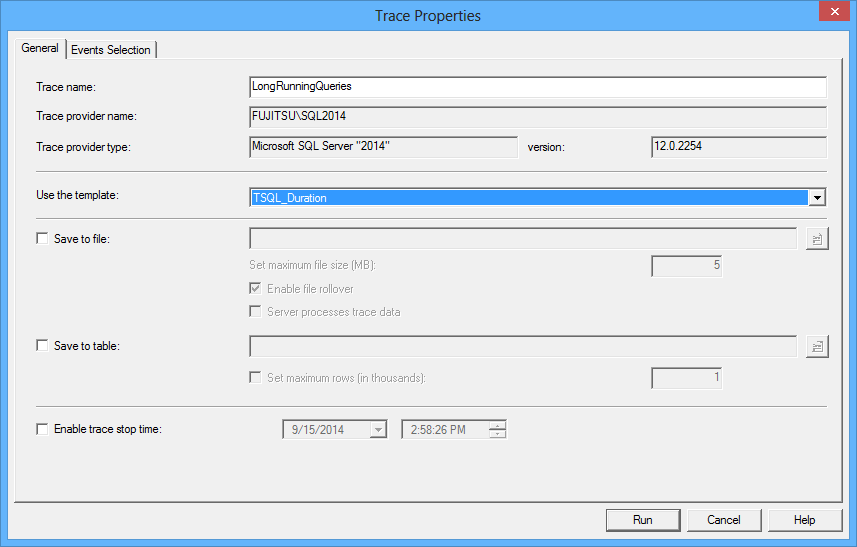
If the Template list is empty, i.e. only Blank is shown, it is most probably because of the different versions of SQL Server and SQL Server Profiler. For example, you’re using SQL Server 2012 Profiler to connect to the SQL Server 2014 database. To fix the issue, either use SQL Server Profiler 2014 or import a template.
Select the Save to file option to save the captured event information into a trace file (.trc) that you can analyze later, or replay in SQL Server Profiler. Keep in mind that when you capture a large number of events and columns on a busy server, the trace file can become huge. If you’re not sure how long you will keep the trace running, to avoid the space issue and analysis of huge files/tables, set the file maximum size.
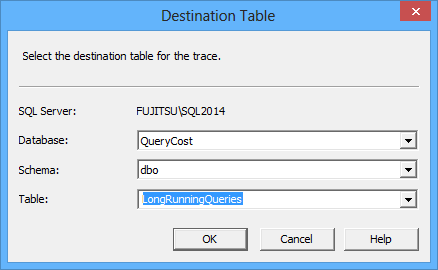
When saving the captured information into a SQL Server table, select the SQL Server instance and an existing database where you want to store the data. The table where the data will be stored is created automatically. If you use this option, don’t select the SQL Server instance where the events are captured, to avoid additional overhead.
- To stop the trace automatically, enable the stop trace time option, and specify the time to stop the trace
-
Open the Events Selection tab to check the events that will be captured. To modify the events and columns in the template, use the respective check boxes.
To add additional events and columns, you have to show them first. To do that, select Show all events and Show all columns.
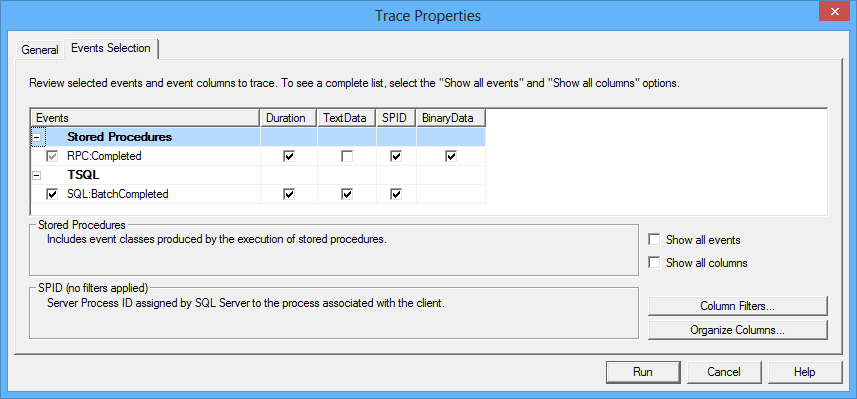
The events specified in the TSQL_Duration template are:
- Stored Procedures RPC:Completed – indicates that the execution of a stored procedure executed as a remote procedure call is finished. The selected columns provide information about the duration, statement executed, server process ID, and binary data. Other useful information, such as processor usage, database name, login name, start and end time, stored procedure name, reads, etc. are not selected by default, so we’ll add them manually. To reduce overhead, add only the columns you really need
Note that this event will not capture the execution of a stored procedure via the EXECUTE statement.
- TSQL SQL:BatchCompleted – indicates that a T-SQL batch execution is completed. The selected columns provide information about the duration, statement executed, and server process ID, so we’ll add additional ones manually
Other events commonly tracked when obtaining the list of expensive queries and statements are:
- Stored Procedures SP:StmtCompleted – indicates that the execution of a T-SQL statement within a stored procedure is completed
- Stored Procedures SP:Completed – indicates that the execution of a stored procedure is completed
-
TSQL SQL:StmtCompleted – indicates that the execution of a T-SQL statement is completed
- To capture traces just for a specific database and set the database name filter, click Column Filters
- In the left pane, select the column name, DatabaseName in this example
-
On the right, expand the Like or Not Like node and type the database name or part of it. You can also exclude system databases
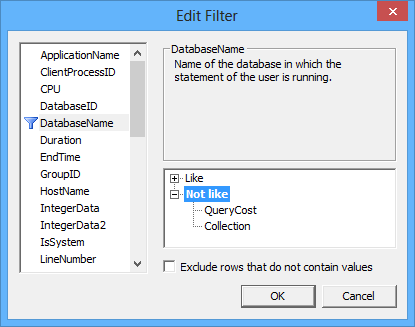
- Click OK
-
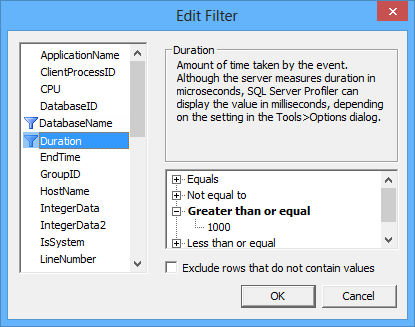
Another useful filter to add when capturing long running queries is duration time. To avoid capturing queries that don’t use too much processor time, specify the processor time threshold and set the filter. Note that the duration is shown in milliseconds and that you should specify 1,000 to avoid capturing queries that last longer than 1 second
-
Click Organize Columns to move the columns in the grid. The columns cannot be arranged by dragging and dropping column headers in the SQL Server Profiler grid, so you have to do that here. The columns in the Groups node will be frozen when you scroll the captured events in the grid
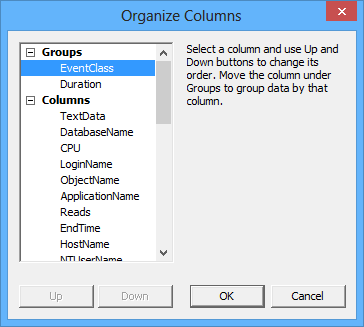
- Click OK
-
To get a clear picture of the selected events and columns, uncheck Show all events and Show all columns, and only the selected events and columns will remain in the dialog.
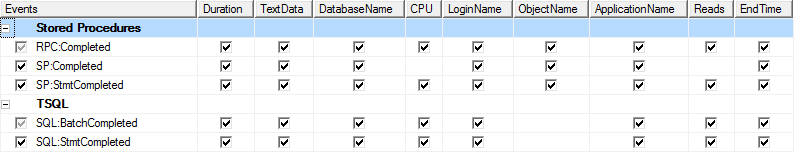
The events with grey checkboxes are the ones defined in the selected template, while the manually added ones have white checkboxes.
-
Click Run
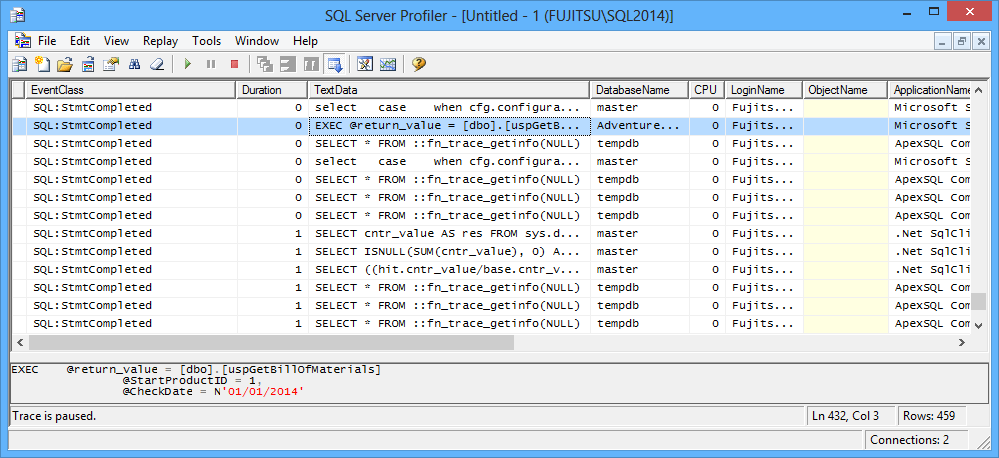
The SQL Server Profiler window will appear with the captured events: executed stored procedures and T-SQL queries. While for the executed T-SQL queries, the complete script is shown, for stored procedures only the stored procedure name and parameters (if any) are shown. You have to find the stored procedure script yourself.
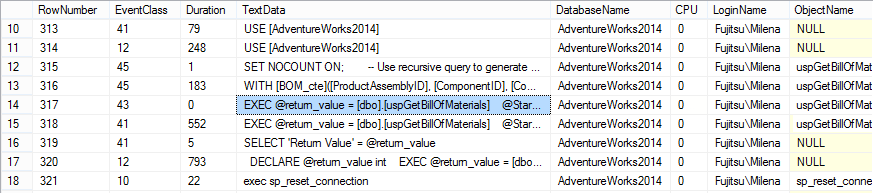
Besides showing the events in this window, all these events are also stored in the table we specified in step 4. Here is the content of the table used to store the captured information
It’s recommended not to use SQL Server Profiler on the server you’re monitoring, as it can add overhead.
In this part of this series, we showed how to use SQL Server Profiler to create a SQL trace for expensive queries. In the next part, we will show how to create such SQL trace using T-SQL and how to analyze the information captured.
October 1, 2014


