


Monitoring and diagnosing SQL Server performance requires monitoring performance metric values, but also understanding these metrics and their relation to other metrics, knowing metric normal values, monitoring resource-intensive processes and queries, etc.
Resource intensive processes use much processor time, memory, and disk while they are executed. Finding them is necessary for performance monitoring and tuning. The next step is to analyze these expensive SQL Server queries and optimize them if possible.
A SQL query cost shows how much resources (processor time, memory, and disk) a query has used during its execution. An expansive query uses a lot of processor time and memory, and has many I/O operations. Therefore, a query cost can be analyzed from a processor, memory, and disk cost perspective.
A slow or long-running query uses hardware resources long and prevents other queries to use these resources, which can eventually lead to blocking. A query that is executed quickly uses memory, processor, and disk for a short time, quickly releases them, so other queries can use them. Common causes of blocking are bad SQL query execution plans, lack of proper indexes, poor application design, bad SQL Server configuration, etc.
That’s why it is important to properly identify long-running queries in real, production scenarios and troubleshoot any potential performance issues in early stages, before it causes serious issues.
A high number for the processor time used doesn’t mean that the query is expensive. For example, the top query, based on the processor time, uses 10,000 milliseconds of processor time. However, it is executed 100,000 times, so a single query execution is 0.1 milliseconds on average, which pushes it to the bottom of the expensive query list. What needs to be analyzed is why the query is executed so many times, and reduce the number of executions if possible
There are several features and methods you can use to find SQL Server query execution cost: Activity Monitor, Data Collection, dynamic management views and functions, SQL Server Profiler.
Activity Monitor
Activity Monitor is a native solution available in SQL Server Management Studio. It provides information about processor time (%), waiting tasks, database I/O, and batch requests/sec in real-time graphs. It also lists currently running processes, resource waits, data file I/O, and recent expensive queries. In this article, we will focus on the recent expensive queries. You can find more information about other Activity Monitor features in this article: SQL Server Activity Monitor
To view Activity Monitor, the SQL Server login must have the VIEW SERVER STATE permission.
- Start SQL Server Management Studio
- To open Activity Monitor:
-
Right-click the SQL Server instance node and select Activity Monitor, or
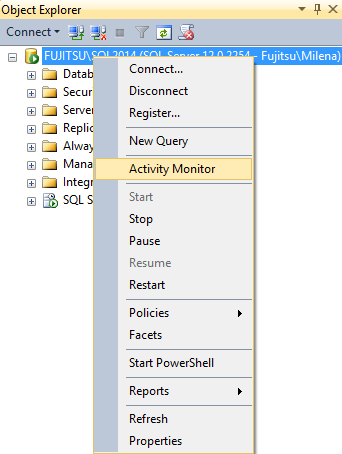
- Press Ctrl+Alt+A, or
-
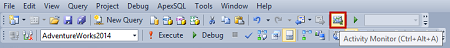
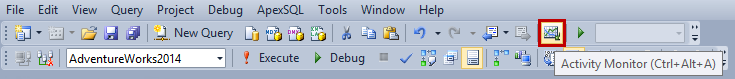
Click the Activity Monitor icon in the menu
-
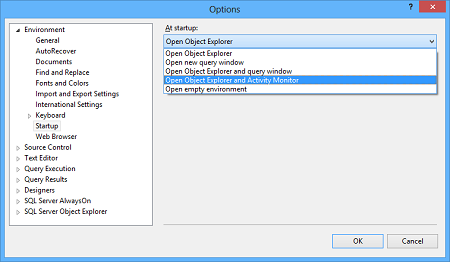
There is also an option to open Activity Monitor automatically when SQL Server Management Studio is started:
- On the menu, select Tools | Options | Environment | Start up
-
In the At startup field, select Open Object Explorer and Activity Monitor

If you don’t plan to use Activity Monitor frequently, don’t use this option as it will increase the time needed to open SQL Server Management Studio.
By default, only the Overview pane is expanded, the other panes are collapsed and you have to manually expand the ones you want to monitor.
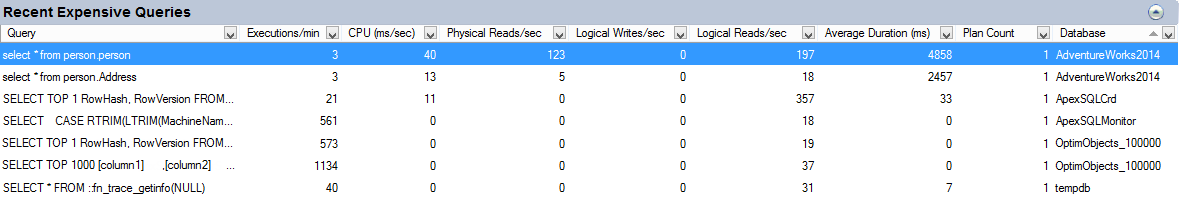
The information about the query cost is monitored and shown only when the Recent Expensive Queries pane is expanded. When it is collapsed, query cost monitoring stops.
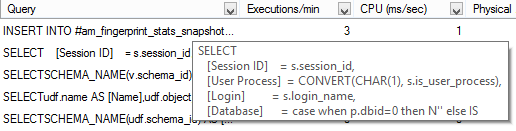
The pane allows you to rearrange the column order using the drag and drop technique, sort the list by a specific column, and filter by one or more column values. To see query code, place your pointer over the query (you don’t need to select it) and code will be shown in the pop-up window.
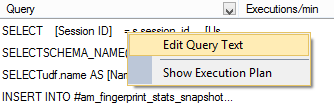
From the context menu, you can open the query in a new Query Editor tab, so you can analyze or modify it, and view the execution plan, which is useful for identifying why the query uses much resources.
The CPU (ms/sec) column in the list shows how much processor time the query used since the last compilation. This is the value of the total_worker_time column in the sys.dm_exec_query_stats view. Note that the value is shown as ms/sec, milliseconds per second. It’s the ratio of processor time used by the query per second. For example, the value 500 means that the query used 500 ms of processor time in one second, in other words half of processor time.
As described, Activity Monitor is available without any additional setup. Besides the commonly monitored performance metrics, it provides a list of recently used queries, their code, and execution plans. These queries are shown in real-time, without an option to save them for later analysis. The grid with the queries can be filtered and ordered. Although Activity Monitor provides sufficient information about expensive queries for query analysis and troubleshooting, other performance parameters necessary in a complete monitoring solution are not available.
Data Collection
Data Collection in SQL Server Management Studio is another native tool that provides performance metrics monitoring and a list of expensive queries. It has three built-in data collection sets: server activity, disk usage, and query statistics. In this article, we will focus on the last one.
Unlike Activity Monitor, it has to be configured to start collecting performance metrics. It uses Management Data Warehouse and SQL Server Agent, and is available in SQL Server 2008 and higher, the Standard, Enterprise, Business Intelligence, and Web editions.
To set up and configure Data Collection, see the steps given in SQL Server performance monitoring with Data Collector – Part 2 – set-up and usage
If you want to use only the Query Statistics collection set, stop the other two from their context menus.
Before opening the report, to ensure that it is created using the latest collected information, select Collect and Upload Now in the Query Statistics context menu.
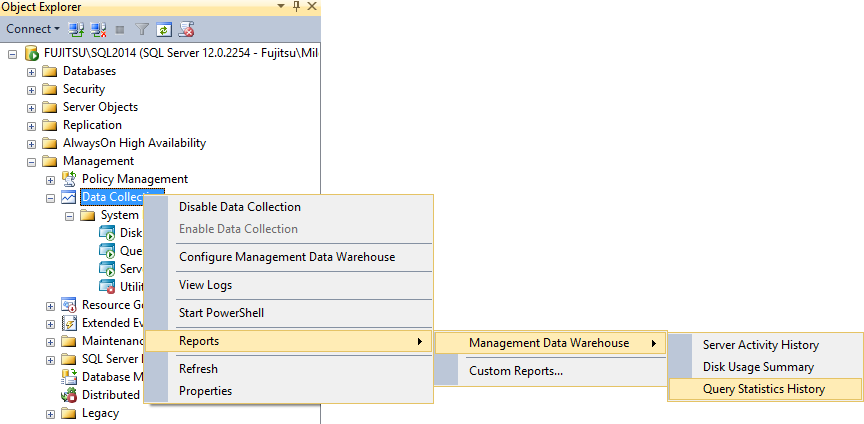
To open the report, in the Data Collection context menu, select Reports | Management Data Warehouse and then Query Statistics History.
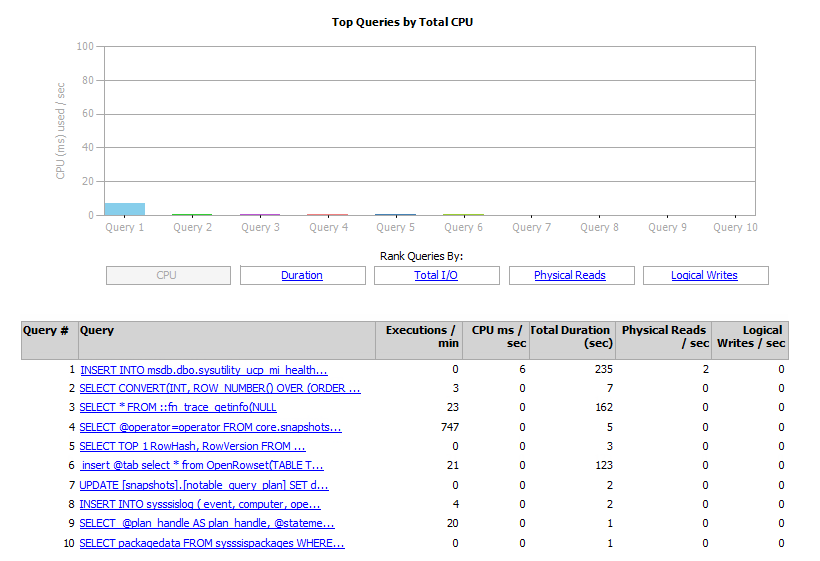
There are 5 graphs available that show query execution statistics for processor usage, query duration, total I/O, physical reads, and logical writes.
The list doesn’t contain the name of the database against which the query was executed, which can be useful for analysis. Note that the CPU (ms/sec) column is in microseconds per second, the same as in Activity Monitor, but its accuracy is in milliseconds. When a query is executed in less than a millisecond, 0 is shown.
To see the queries executed during a specific time range, click on the timeline shown at the top of the report, or use the navigation options below the timeline.
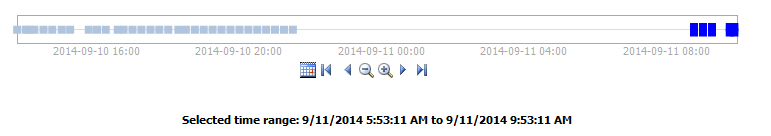
The selected time range is highlighted in the timeline and indicated in the label below the timeline. Whenever you select a new time range, or a new graph in the report, information is updated, which delays the report. By default, historic data is kept for 14 days, but Data Collection can be configured to keep the historic data indefinitely. If you use this option, keep in mind that the database that hosts Management Data Warehouse can become large.
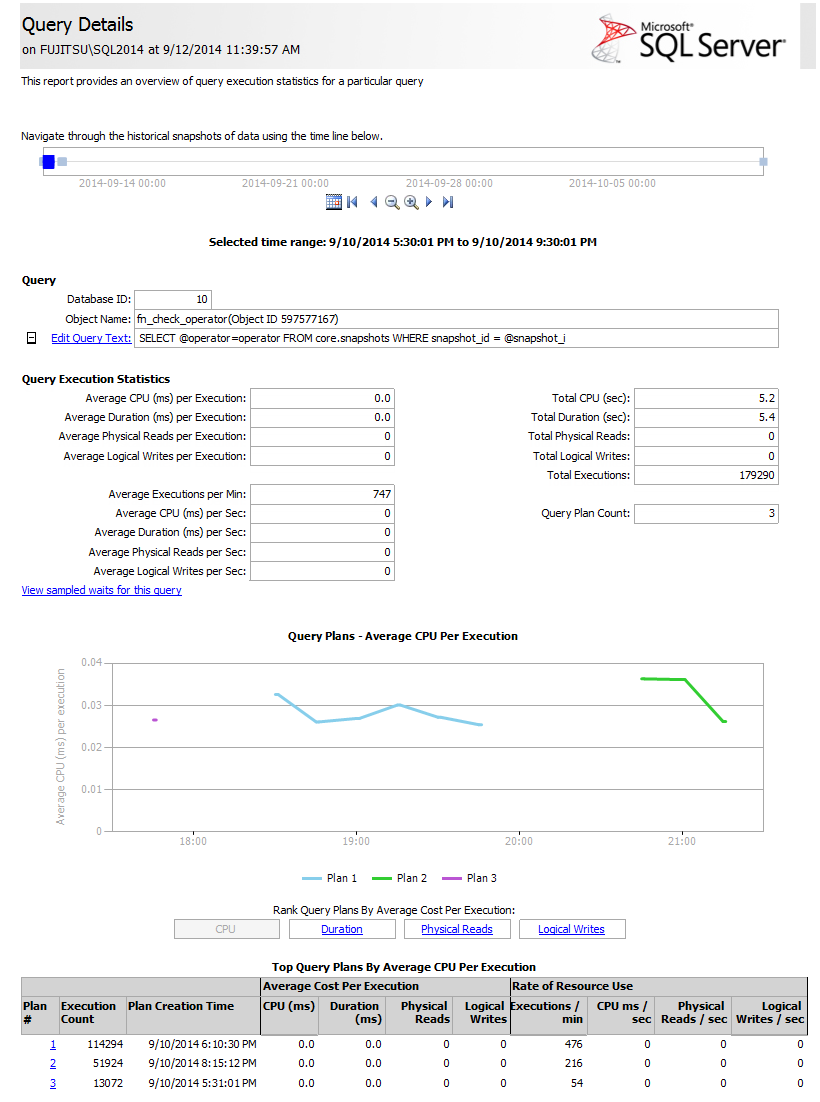
The list shows 10 most expensive queries. Each query is represented by a link that opens the Query Details report, where the complete query, along with query execution statistics in tables and graphs are shown. The Edit Query Text link opens the query in a new Query Editor tab, so you can modify it.
The same as Activity Monitor reports, these can be exported into Word, Excel, and PDF files.
As the data collecting process can affect overall SQL Server performance, it’s recommended to keep the Management Data Warehouse on another instance, and to keep the collection frequency value higher than 5 seconds, as it will degrade performance otherwise.
The query statistic info is obtained by querying sys.dm_exec_requests, sys.dm_exec_sessions, sys.dm_exec_query_stats and other related dynamic management views.
The same as Activity Monitor, Data Collection collects the queries executed against all databases on the SQL Server instance. The advantage of Data Collection over Activity Monitor is that Activity Monitor shows only currently running queries, while Data Collection keeps history data and that it collects information continuously after it’s been started.
Although Data Collection provides enough useful information about recent expensive queries, because built-in data collection sets cannot be easily modified, nor new ones added without coding, a user is limited to a predefined set of collected metrics, which makes this feature is useful only for basic performance monitoring.
Resources:
Activity Monitor
System Data Collection Set Reports
Management Data Warehouse
September 16, 2014


