


Blocked processes caused by locks on database objects are a common issue. Locking ensures the integrity of data stored within databases by forcing each executed SQL Server transaction to pass the ACID test. which considers that every transaction must meet the following requirements:
- Atomicity –a transaction must be either fully completed when executed, or it will not execute at all
- Consistency – transactions must create a new state of data that is valid, or if any failure occurs, it must return all data to the state that was actual before the transaction is executed/started
- Isolation – a transaction that is in process of execution and is not committed yet, must be isolated from all other transactions
- Durability – committed data must be saved in a way that will maintain data in correct state if a transaction does not complete in the event of a failure and restart of the system
As part of the ACID test, isolation is carried out by locking affects objects and as such, isolation can affect one or more data rows until the SQL Server transaction that is executed against that object is committed. This means, in practice, that by locking the object, SQL Server will prevent any other process from making any change against the data in that object until the lock is removed, either by committing the change or rolling it back.
Imposing the lock over an object will cause any other process that imposes a request against the locked object to wait until the lock is removed, which will delay execution of that process. The state when a transaction is waiting for the lock to be removed or stopped is what is known as a block. SQL Server is designed to work this way and, as such, blocks are not inherently problematic. Therefore, only when a high level of blocks is detected on SQL Server or in a case in which blocks occurs that require excessive amount of time to be resolved should it be treated as a potential issue
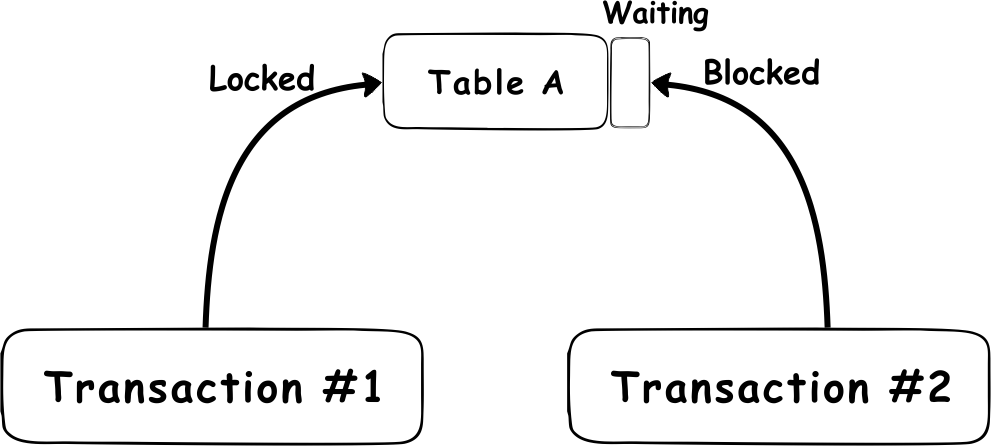
A practical example of SQL Server blocking is when Transaction #1 is trying to update data in Table A, and while Transaction #1 is still running and is not completed, Transaction #2 tries to place a new lock on Table A; If the row that should be deleted is also the row that will be updated by Transaction #2, then Transaction #2 will encounter a block. This is because Transaction #1 has an exclusive lock imposed on the table while the transaction is running
Let’s take following scripts as an example
Script 1
BEGIN TRAN
UPDATE [dbo].[TableX]
   SET [ZAP_ID] = 5
 WHERE [ZAP_ID] = 9

COMMIT
Script 2a
DELETE FROM [dbo].[TableX]
    WHERE [ZAP_ID] = 9
Script 2b
SELECT COUNT(*) FROM [dbo].[TableX]
Script 2c
TRUNCATE TABLE [dbo].[TableX]
These scripts will be used for creating a SQL Server block
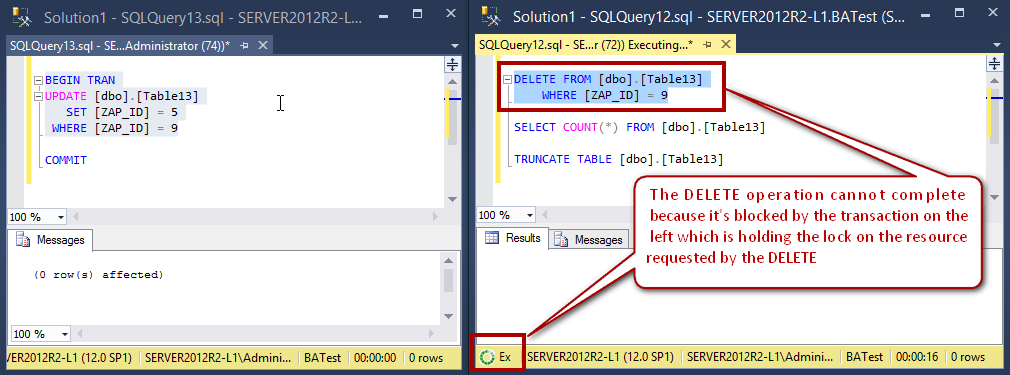
First, execute Script 1, but only the part highlighted in yellow (do not execute the COMMIT command). The script will start a transaction and it will place a lock on the specific rows in TableX
Now, execute any of the other scripts and they will not be able to complete because the initial transaction will hold its exclusive lock on the same rows in TableX that other scripts are trying to access. As a consequence of this, scripts will have to Wait on the transaction to complete (to perform COMMIT of the transaction)
This simple example illustrates a situation when one transaction, that is in progress, can BLOCK one or more processes that must wait until the transaction with exclusive lock completes or is rolled back
So how do we identify instances of SQL Server blocking? There are a couple of ways to do this in SQL Server:
- Using activity monitor
- Using SQL Server DMVs
Use Activity monitor
Activity monitor is an SQL Server Management Studio tool that enables user to see details of existing SQL Server connections, and it can be used to show information about the open processes and locks on SQL Server resources.
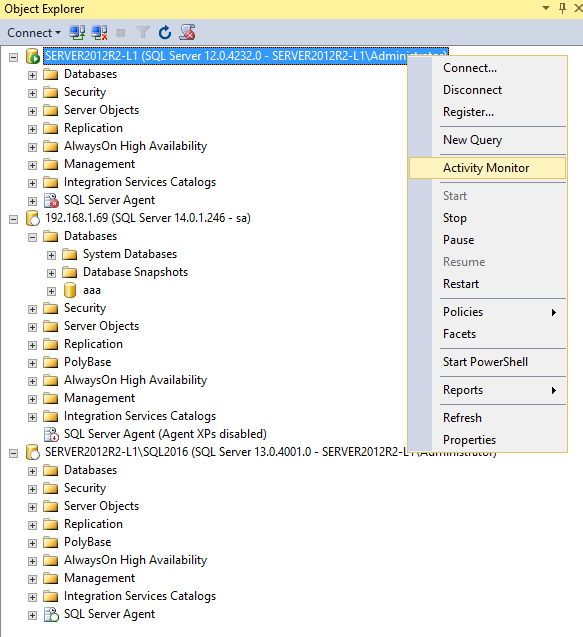
To open Activity Monitor in SQL Server Management Studio, right-click the SQL Server name in Object Explorer and click Activity Monitor
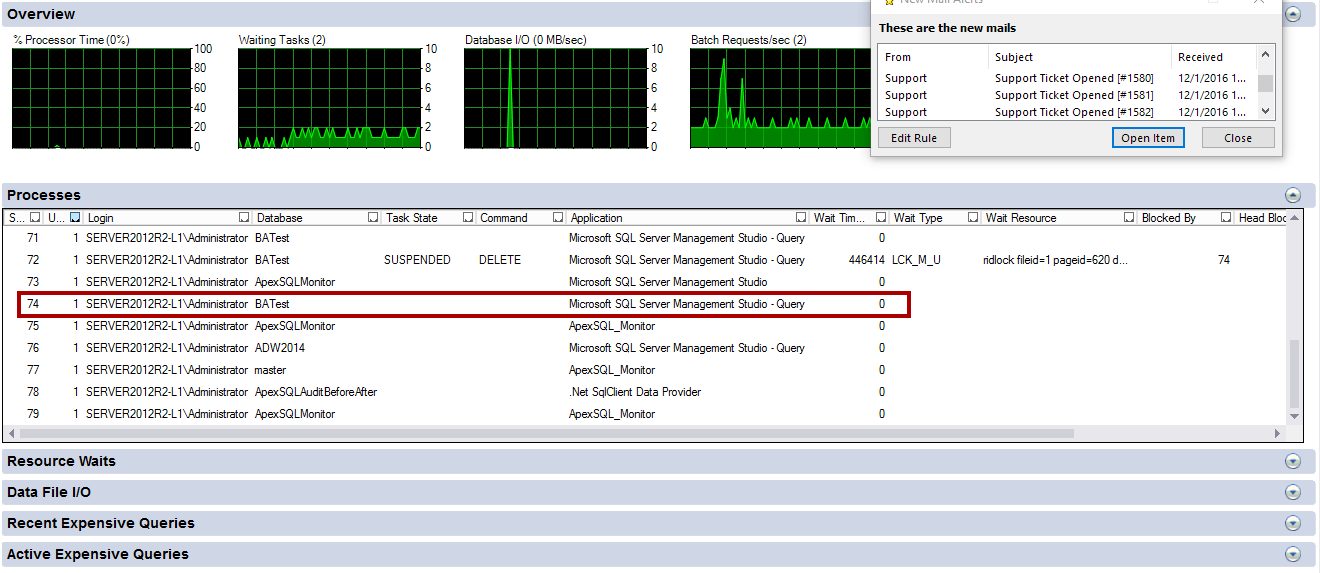
Expand the Processes and locate the process that is waiting. Once the process is located, take a look at the Blocked by column to find the process ID that is caused the blocking
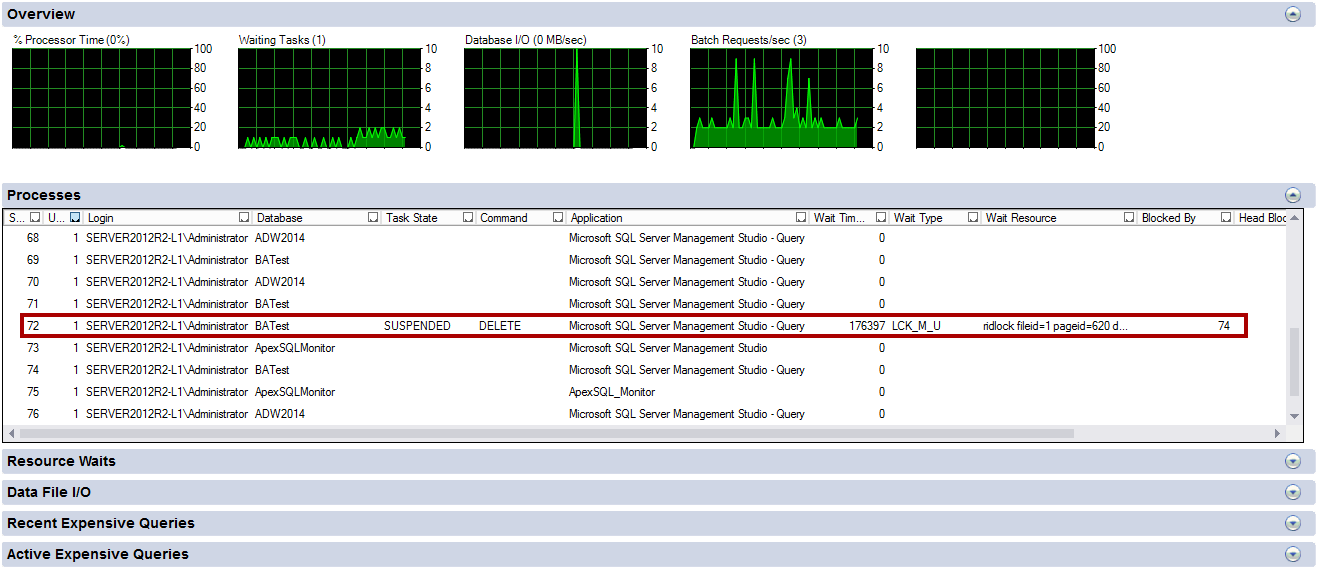
Now when the process, that is causing the blocking, is identified, it has to be located in the same Processes page
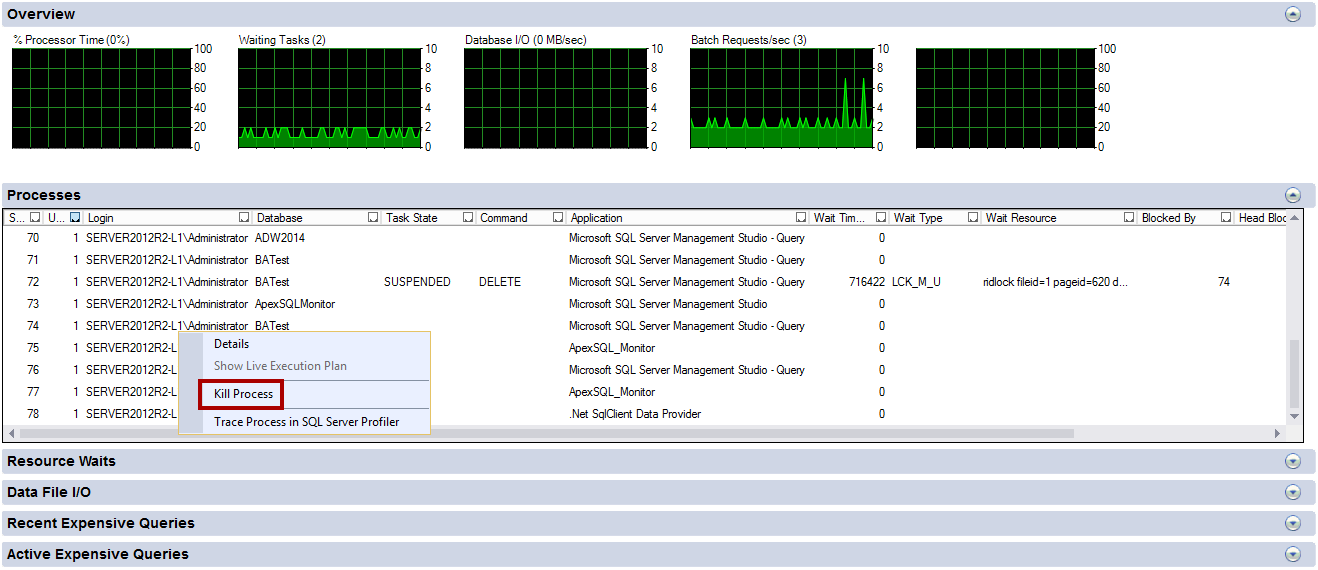
Now when the information about the process that is causing the blocking is found, the user might opt to kill that process or to allow it to run until completes. To Kill the process, right click on it and select Kill process
Using DMVs
The dynamic management view, sys.dm_exec_request, is used for identifying the SQL Server blocks. It can be used to list currently active blocks by executing the following query
USE [master]
GO
SELECT  session_id,
blocking_session_id,
wait_time,
wait_type,
last_wait_type,
wait_resource,
transaction_isolati,
on_level,
lock_timeout
FROM sys.dm_exec_requests
WHERE blocking_session_id <> 0
GO
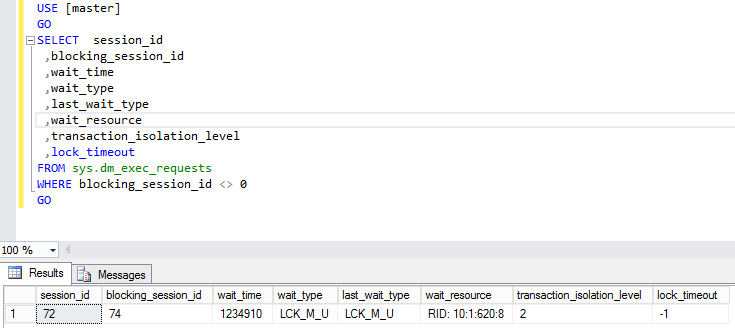
In the results it can be seen which process is blocked (session_id), what process is blocking (blocking_session_id), what wait type is involved and what the wait time of that blocking is as well as the resources involved
To terminate the blocking session, ID 74 in this case, use the KILL command
KILL 74
GO
|
Quick tip: Take care when killing a process and make sure that there is a complete understanding of what that process is doing and why it is causing blocks. When a transaction is killed, all data changes made by that process to be rolled back into a previous state. |
But these native SQL Server methods can be used only for detecting and identifying active blocks. In many situations, when a block is detected and identified, it is important to know whether this constitutes normal behavior and whether it occurs rarely or only once. Without such information, it is not possible to perform required troubleshooting, simply because no historical data about blocks are available, such as blocking frequency and the extent of blocking
Useful resources:
- How To Find locked tables and Kill Session IN Sql Server
- Troubleshooting blocking issues in SQL Server 2000 and 2005
- Microsoft – SQL Server – Wait Resource – Database Object and Page
- Better documentation for tasks waiting on resources
December 12, 2016


