


This article will be about how to include Data model diagrams in the documentation generated by ApexSQL Doc. With this feature, it’s possible to see graphically display database tables and their relationships.
ApexSQL Doc is a tool used for documenting Tableau sites, SharePoint farms, SSIS packages, SSAS cubes and SQL Server databases with Data model diagrams.
Apex SQL Doc can generate various documentation in Word, HTML, PDF or CHM formats, and has the options to fully customize the process of documentation with custom texts, styles and pictures.
This article will include a brief introduction of the full process of documenting Data model diagrams, by using the graphical user interface, and in the end the process will be automated using the command line interface.
Documenting Data model diagrams via GUI
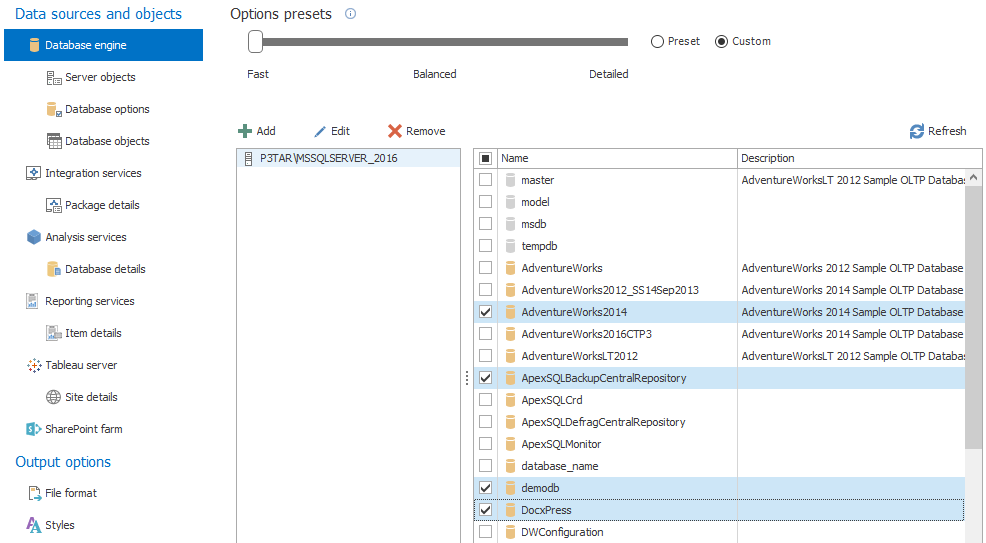
The first step will be to add a database to document. To select a database, click the Add database button. Once that is clicked the login menu will appear. Select the SQL Server where the database is located, and the authentication type which will be used to connect to that server. Once this is done, click OK.

When the connection is established, a list of connected databases will be displayed. Now, select the desired database from the database section on the left.
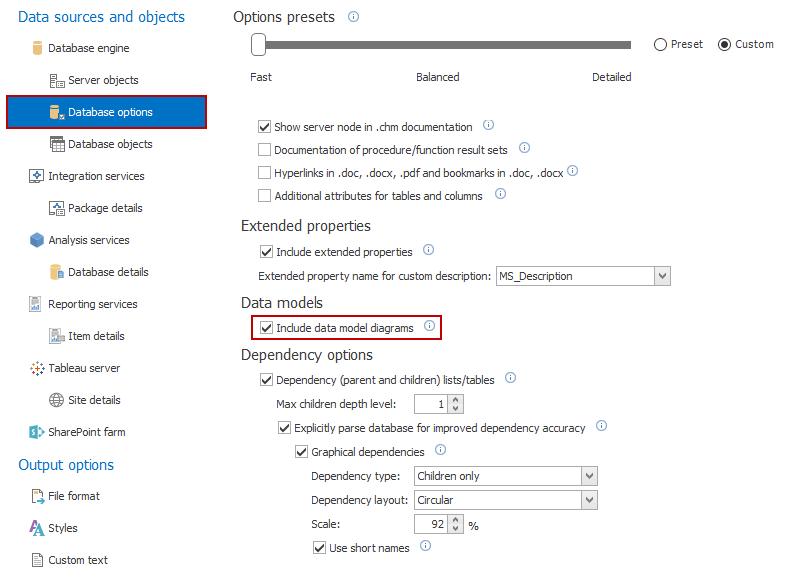
The next part of the process is the selection of options. In order to document Data model diagrams, include the option in the Database options tab. Just scroll down to the bottom and find the Data model diagrams option, check it and let’s move on to the next step.
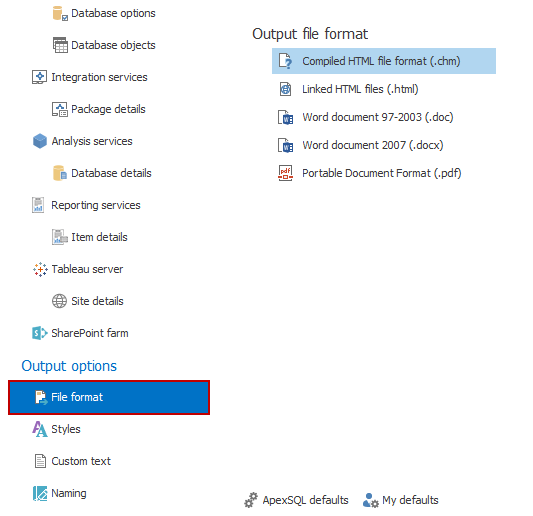
Next choose the output format of the database documentation.
ApexSQL Doc offers the option of documenting in CHM, HTML, DOC, DOCX and PDF format.
Each documentation format has its own way of displaying data model diagrams. In CHM and HTML formats, data models can be found by clicking a hyperlink which will open a new window. On the other hand, in Word and PDF format, data models can be found alongside the rest of the data in each table.
To select the required format, click the File format label and choose the wanted output type.
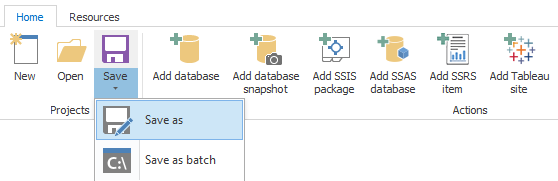
Once the whole process of setting up the project is completed, it would be the best, to save the project file. To do that, click the Save button in the Home tab or use the Save as button, located under it.
Now, everything is ready to start the documentation process. Just click the Generate button and choose the location where to generate the documentation.
The documentation can be generated in a custom location otherwise ApexSQL Doc will use the default location: “C:\Users\Documents\ApexSQL\ApexSQLDoc”
|
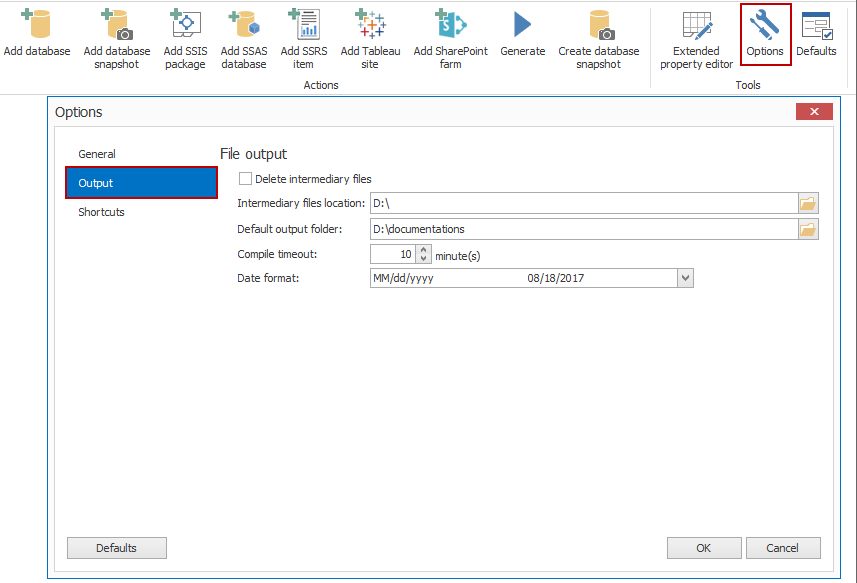
Quick tip: ApexSQL Doc uses intermediary files for documentation and they are automatically deleted after the documentation process. If the intermediary files are needed for later use, turn off the option “Delete intermediary files” in the Options menu. |
When the process is complete, the documentation will be created:
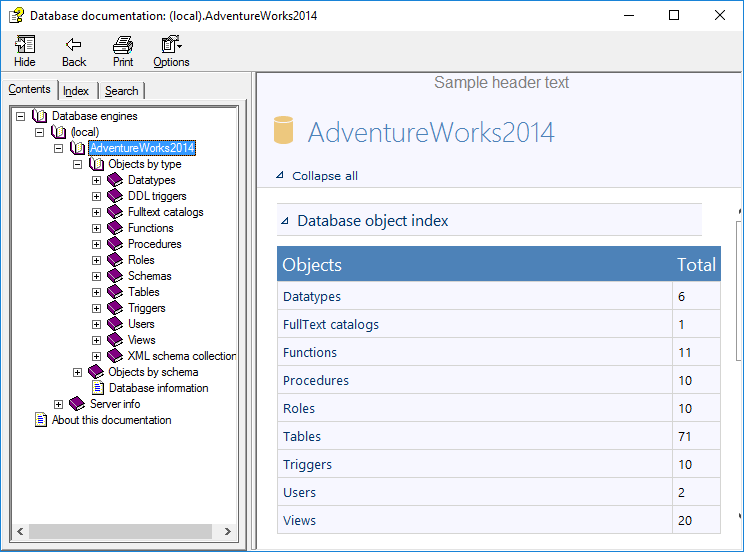
In our example, the documentation is generated in CHM format.
To find the documented Data model diagrams, select a Table and scroll down in the right preview window to the Data models section and click the underlined hyperlink.
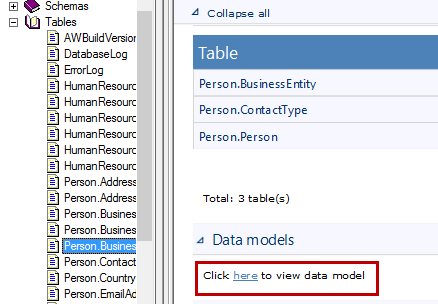
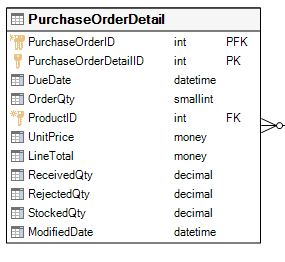
A graphical display of the selected table and its relations to other tables will be shown like in the picture below.
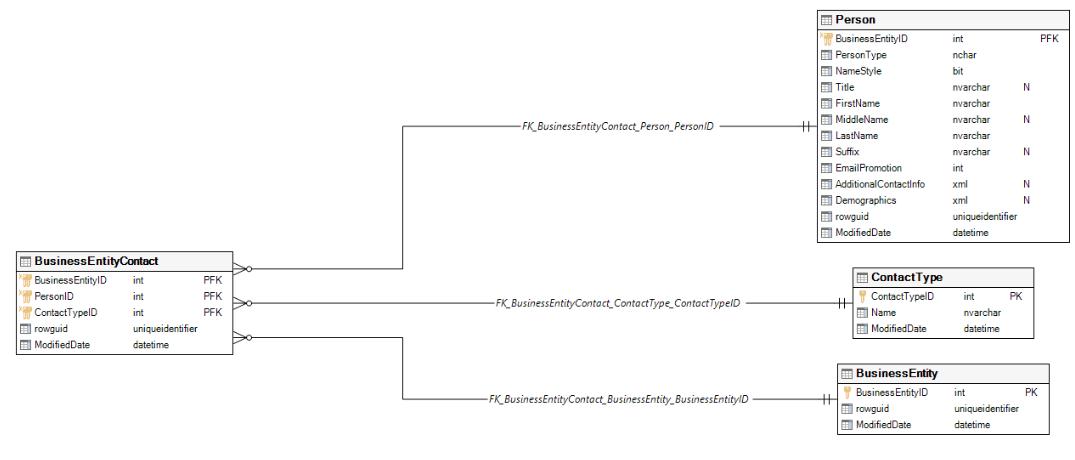
ApexSQL Doc uses a hierarchical layout for arranging the diagram elements automatically so the user can view the tables and relationships the best way possible.
Basic information for each database table like: names of table columns, data types, nullability of column values (N), foreign keys (FK), primary keys (PK), primary and foreign key constraints (PFK) is displayed.
Types of relationships between tables in Data model diagrams
Every relationship between two tables has a name and is graphically displayed on in label on top of the relationship.

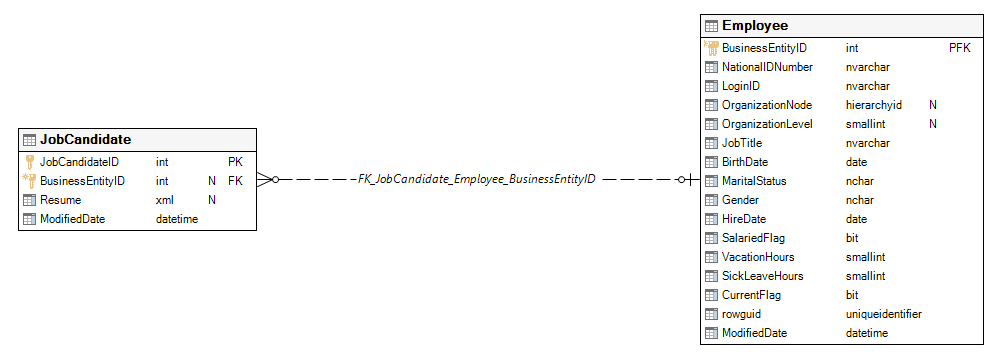
A Non-identifying relationship is where the primary key of the child entity can be identified as independent from the primary key of the parent entity and the attributes of a parent primary key must not become the attributes of a child primary key. This relationship can be mandatory or optional. This means that the foreign key allows or disallows NULLs. A non-identifying one-to-many relationship is displayed with a “crow’s foot” symbol and a broken line as can be seen in the image below.
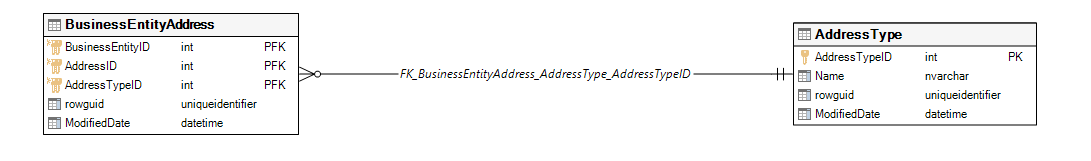
An Identifying relationship is when the primary key of a parent is included in the primary key of the child and when a child table cannot be identified uniquely without a parent table.
Example: A User has a lot of serial keys. If that User had just one serial key, it could be simply stored in a column named User. And since there needs to be support for multiple serial keys, a second table must be created with a name SerialKeys, where the primary key includes the User_id referencing the User table.
An identifying one-to-many relationship is displayed with a “crow’s feet” symbol and a straight line like in the picture below.
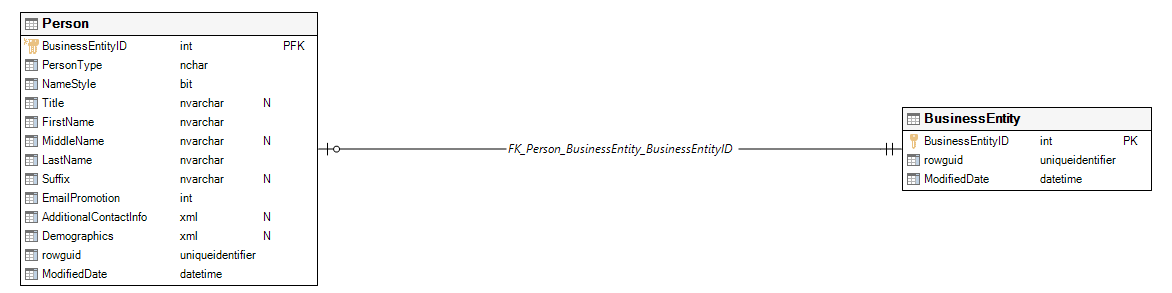
An identifying one-to-one relationship can be seen with a cross/circle symbol and a straight line like in the picture below.
To find a specific image file, select the table that from the generated documentation and look for the Object ID in the preview section on the right side.
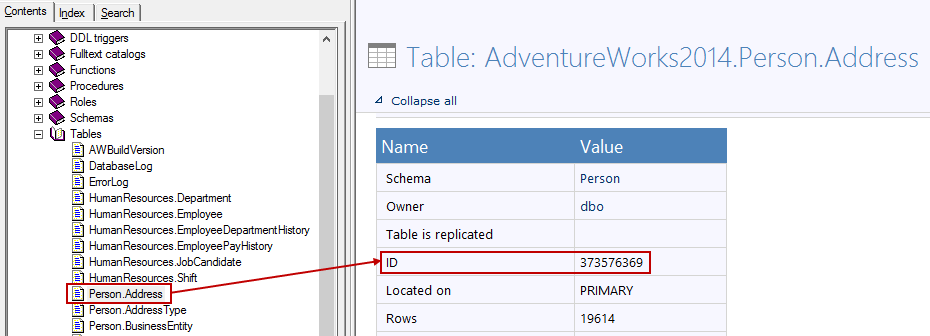
After that find the image using the ID number in the Intermediary folder.
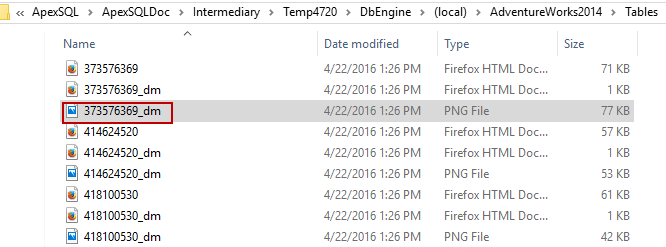
Every data model diagram image is saved with a “_dm” suffix after the object ID number. These images are saved in “.png” format in the Intermediary folder.
The Intermediary files can be found in a default location, for example: “C:\Users\AppData\Local\ApexSQL\ApexSQLDoc\Intermediary\Temp4720\DbEngine\(local)\AdventureWorks2014\Tables”. It is also possible to save those files in a custom location which can be specified in the options menu shown earlier.
References:
- ApexSQL Doc feature highlight: Data model diagrams aka ERD
- How to automate SQL database documentation
- Document SSIS packages and SQL databases using ApexSQL Doc
April 26, 2016


