


In the previous part of this series, we described why tracking most expensive queries is important and how to use SQL Server Management Studio native solutions. In this part, we will focus on dynamic management views and functions.
Querying dynamic management views and function
Dynamic management views (DMVs) and functions return internal information about SQL Server instance and database state, therefore are useful for performance monitoring and troubleshooting. There are two types of dynamic management views and functions: server-scoped (require the VIEW SERVER STATE permission on the SQL Server instance) and database-scoped (require the VIEW DATABASE STATE permission on the database). Both require the SELECT permission on the view.
All dynamic management views and functions belong to the sys schema. To see all available views, in SQL Server Management Studio Object Explorer, expand the master database, then the Views node and System Views. Dynamic management view names start with dm_. Similar goes for dynamic management functions.
Views are grouped into several categories. The focus in this article will be on the execution related dynamic management views. Their names start with dm_exec_.
sys.dm_exec_query_stats is a server-scoped view that provides performance statistics about cached execution query plans. When used, execution plans are stored in SQL Server memory called the procedure cache.
It’s recommended to avoid executing:
SELECT * from sys.dm_exec_query_stats
Besides the performance issues that the SELECT * statement brings (this view has 40 columns), another reason is that Microsoft has announced that dynamic management views will be modified in the future SQL Server versions, and new columns can be added. In SQL Server 2014, there are already two columns with NULL values (statement_sql_handle and statement_context_id) added, reserved for the future versions. The same goes for all dynamic management views.
Microsoft also recommends re-running a query to obtain more accurate results, as the initial ones can be inaccurate.
The returned result set contains a row for every statement in the cached plan. As the view doesn’t provide text of the SQL statements executed, to be able to analyze the results further, joining to another dynamic management view is necessary.
The sys.dm_exec_query_stats columns used in the following examples and other commonly used columns:
sql_handle uniquely identifies the batch or stored procedure the query belongs to. It can be used with statement_start_offset and statement_end_offset columns to obtain the exact query text from sys.dm_exec_sql_text.
plan_handle uniquely identifies a query plan for a cached or currently executed batch.
statement_start_offset and statement_end_offset indicate the position in the batch where the query starts or ends, respectively.
last_execution_time is the time when the last execution of this plan started.
execution_count is the number of times the plan was executed since the last compilation.
total_worker_time is the processor time used to execute the specific plan since the last compilation. The value is shown in microseconds. The value for each execution is rounded to milliseconds, which makes the values for plans executed in less than 1 millisecond inaccurate.
last_worker_time is the same as total_worker_time, but for the last plan execution.
min_worker_time and max_worker_time show the minimal and maximal processor time used by the plan. The value is shown in microseconds.
total_rows, last_rows, max_rows, and min_rows show the total number of rows returned by the query, number of rows returned by the last query execution, maximal, and minimal number of rows returned since the last compilation. Neither column can be NULL.
sys.dm_exec_sql_text is a server-scoped function that provides text of the SQL batch. The function requires a parameter that can be sql_handle or plan_handle, depending on whether you want to find information for a SQL query or execution plan.
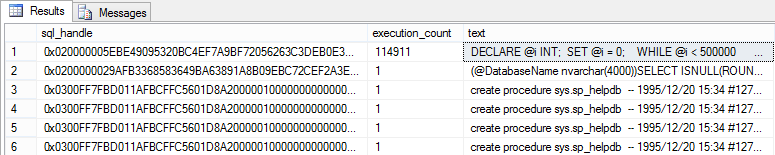
We’ll start with finding how many times each query was executed. In this example, we will retrieve just the number of executions and text for the SQL query, without any calculations. Note that we’ve used sql_handle as the sys.dm_exec_sql_text function parameter:
SELECT qs.sql_handle,
       qs.execution_count,
       st.text
  FROM
       sys.dm_exec_query_stats AS qs
  CROSS APPLY sys.dm_exec_sql_text(qs.sql_handle)AS st
  ORDER BY qs.execution_count DESC;
The query returns the information about all queries found in the cache.
To obtain more useful information about the query cost, add additional columns to the query.
When analyzing the total processor time used, be aware that it doesn’t indicate a slow query. In an example like the one above, the total time is huge, as the statement is executed many times, but a single execution doesn’t last long. It’s useful in such situations to know the average processor time per query execution. It is calculated as the total time the processor used to execute a query divided by the number of query executions, i.e. total_worker_time/execution_count. For a huge number of executions, it’s recommended to optimize a query (in this example, a BULK INSERT statement would be a better solution).
To see the memory and disk pressure, we will add information about total and average physical reads, logical reads, and logical writes. The average value for each is calculated as total_value/execution_count.
SELECT qs.execution_count,
       qs.total_worker_time,
       qs.total_worker_time / qs.execution_count AS 'Avg CPU Time',
       qs. total_physical_reads,
       qs.total_physical_reads / qs.execution_count AS 'Avg Physical Reads',
       qs.total_logical_reads,
       qs.total_logical_reads / qs.execution_count AS 'Avg Logical Reads',
       qs.total_logical_writes,
       qs.total_logical_writes / qs.execution_count AS 'Avg Logical Writes',
       SUBSTRING(st.text, qs.statement_start_offset / 2 + 1,
		(CASE qs.statement_end_offset
                     WHEN-1 THEN DATALENGTH(st.text)
                     ELSE qs.statement_end_offset
                     END
		   - qs.statement_start_offset) / 2 + 1)AS statement_text
  FROM sys.dm_exec_query_stats AS qs
  CROSS APPLY sys.dm_exec_sql_text(qs.sql_handle)AS st
  ORDER BY qs.execution_count DESC;

Dynamic management views and functions provide all information needed to find most expensive queries currently running, or recently executed where their execution plan is still in the cache. Using them requires only basic coding knowledge, but deeper understanding of dynamic management views and functions, and the values they return. They can only show queries that are in the cache, so if there was an expensive query that’s replaced in the cache by a new one, the result set will not show it.
In the next part of this series, we will show how to use SQL traces to find the most expensive queries.
Resources:
Dynamic Management Views and Functions (Transact-SQL)
Execution Related Dynamic Management Views
sys.dm_exec_query_stats (Transact-SQL)
September 30, 2014


