


Efficient SQL Server performance monitoring includes monitoring of operating system, SQL Server, and database performance. In How to monitor your SQL Server instances and databases, we presented tools for monitoring the latter two performance metrics, In this article, we will present tools that provide operating system performance monitoring.
Monitoring performance of all three above mentioned groups provides a complete picture of system health and vital information needed for troubleshooting performance problems and bottlenecks. Operating system performance metrics are related to performance of disk, memory, processor, and network. Some of the most important system performance metrics are available memory, average bytes per read/write, average read/write time, disk reads/writes per second, network utilization, pages input per second, pages per second, processor queue length, and processor usage.
The choice of metrics that will be used for monitoring will depend on monitoring goals and performance requirements. It’s important that, a DBA is able to improve performance based on the monitoring results, but also to recognize potential issues and bottlenecks on time, and fix them before they affect the system.
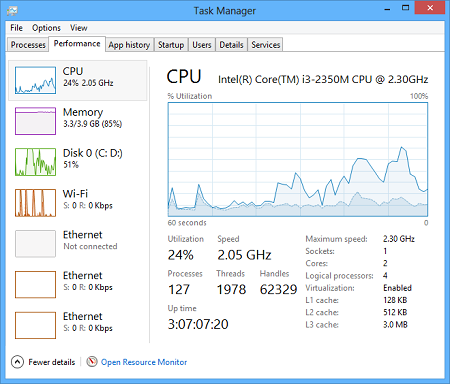
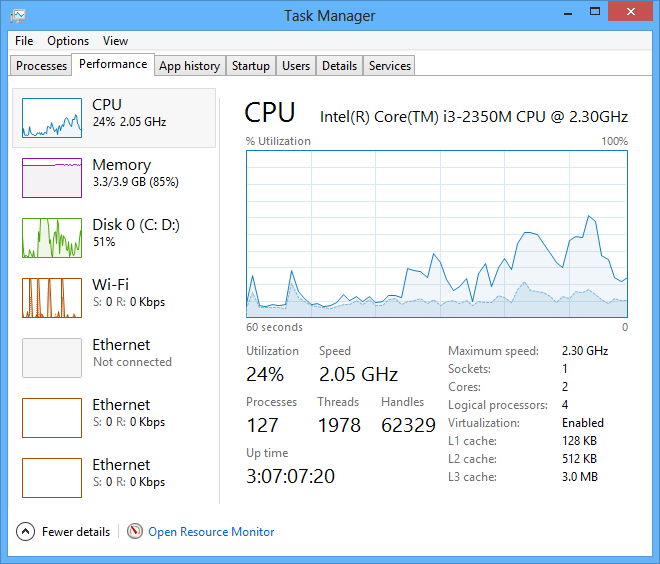
Windows Task Manager
This is a native Windows monitoring tool that is useful for basic monitoring and troubleshooting. It can be helpful for determining where the bottleneck is: on a disk, processor, memory, or network. Other than that, it doesn’t provide enough information for determining the exact problem
- To open it, click Ctrl + Alt + Del and select Task Manager. Alternatively, right click on the Taskbar and select the Task Manager from the context menu
- Select the Performance tab
-
In the left pane, select the hardware component you want to monitor: processor, memory, disk, or a network adapter
Additional information that can be useful for further analysis are shown in other Windows Task Manager tabs and in Resource Monitor.

This information can only indicate the applications and processes that are using the most of computer resources at the moment. There’s no history or statistical data for deeper analysis and troubleshooting of existing or potential performance issues. However, the tool is useful, handy, Windows users are used to it, and is excellent for killing unwanted and non-responding processes.
Windows Performance Monitor
Windows Performance Monitor is a native Windows tool. Besides system performance metrics, it supports a wide range of performance metrics, including SQL Server, SQL Agent, database, and many other. It shows performance metrics in real-time graphs and allows custom selecting of the metrics that will be displayed, defining of metric threshold values, reports generation, and insight in historical data (historical data are available only for the period from the last computer restart)
- To start Windows Performance Monitor:
- Click Start and go to Run. In Windows 8, click Windows + C. Type perfmon and press Enter
- Open Windows Control Panel, go to System and Security, Administrative Tools, and click Performance Monitor
- Select Monitoring tools, Performance Monitor in the left pane
- Select and configure the performance metrics you want to monitor. To add a metric:
- Right-click the graph and select Add Counters in the context menu
- Press Ctrl + N
- Click Add (the green plus icon) in the menu
- In the Add Counters dialog, select the computer
-
Expand the metric group and select the metrics you want to monitor
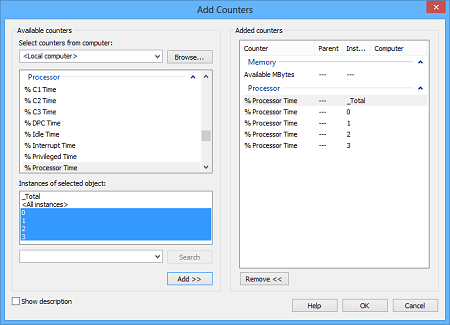

Note that some of the metrics can be displayed as an average value. For example, processor metrics can be shown as total values for all processors/cores available on the machine, but also as individual values for each processor/core.
All selected metrics are monitored in a single graph. As this can be difficult to track, you can uncheck the Show box to hide the metric and get a clearer picture. Another trick is to highlight (Ctrl + H) a specific graph.
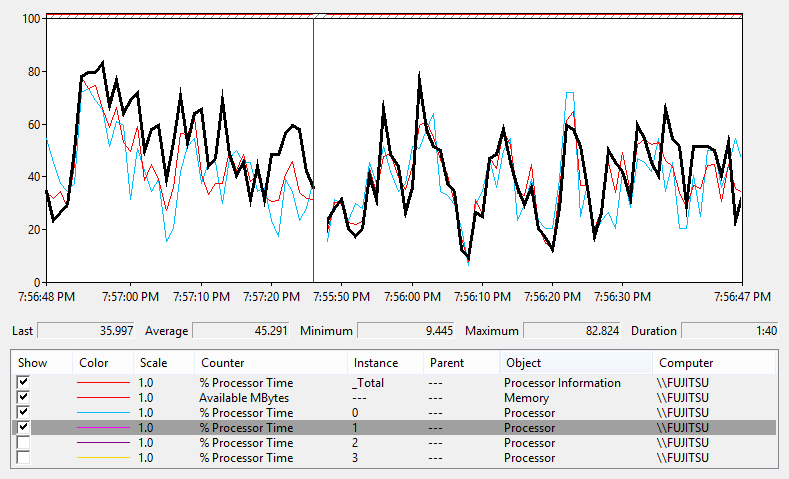
Besides showing the values in the graph, Windows Performance Monitor also provides a text report and a histogram presentation of the data. It provides creating Data Collector Sets that can be used for collecting performance metric values, and show historical data saved in logs.
Windows Performance Monitor is an easy to use tool with low overhead. It provides a wide range of performance counters, but when deeper analysis is required, it cannot provide all the necessarily information. Alerting is limited and doesn’t provide useful details.
July 16, 2014


