


In this article, a feature in ApexSQL Complete that keeps track of executed queries will be introduced. ApexSQL Complete is a productivity add-in for SSMS and Visual Studio, that features SQL auto-complete, SQL formatting, and more.
Executed queries is a feature that keeps track of all queries which have been executed in SSMS and Visual Studio, by saving them to the certain location. Every query which has been executed will be presented in the Query history window.
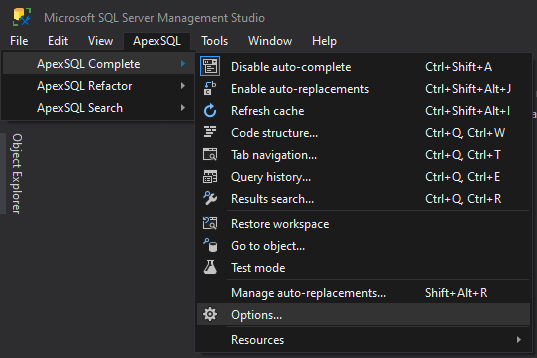
The Executed queries feature can be enabled from the ApexSQL Complete menu, with a click on the Options command:
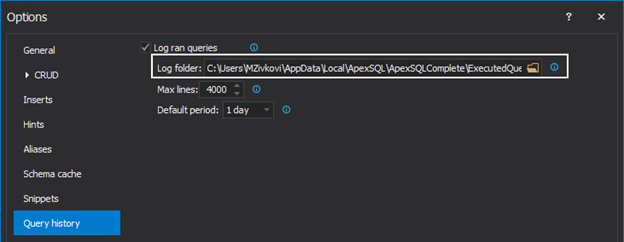
In Options window, go to the Query history tab, by clicking on it, in the menu on the left side. There, the Log run queries option needs to be checked, and the path location, where logs will be saved, can be set up. The log is saved as an .xml file. The maximum number of lines per query can be set, so that queries with larger number won’t be logged. Also, there is an option to set a time period for which logs will be displayed on startup of the Query history window:
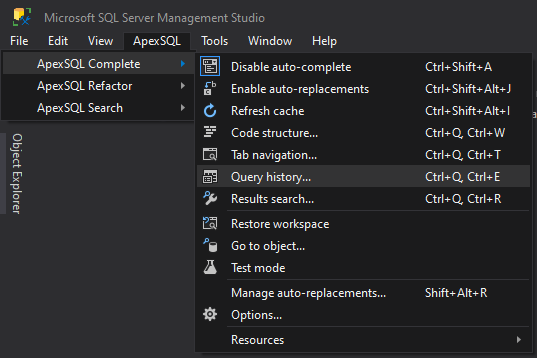
After these options are set, the Query history feature can be called, by going to the ApexSQL Complete menu, and click on the Query history command, or by calling it with the shortcut Ctrl+Q, Ctrl+E:
The following window will appear, which shows all ran queries:
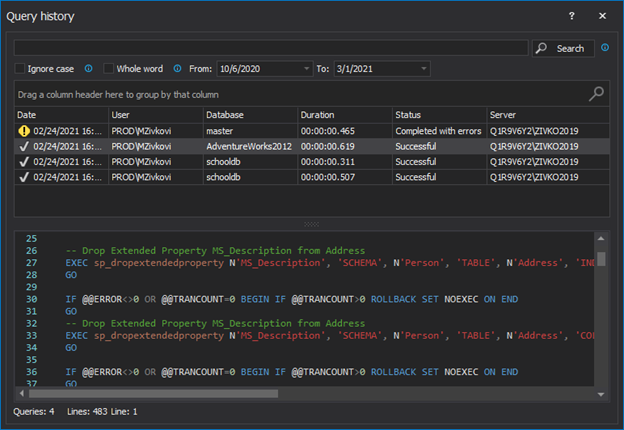
From this window, useful information about queries that have been executed is shown. By selecting the wanted query, it can be found out when the query was executed (time and date), execution status (was it successful, or with errors), query execution time, and for which database was the query executed. Also, all of the code for the selected query from the Details pane can be seen.
The content of all executed queries can be searched, by entering the desired word that needs to be found. The search can be performed by ignoring the case, or by searching the whole word. For example, check the Ignore case option, and search for the “production” word:
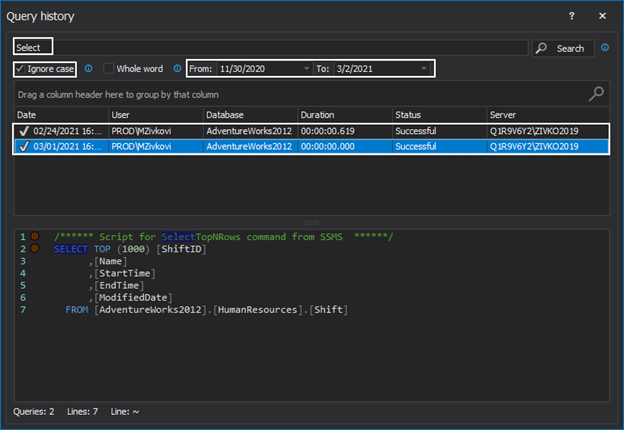
As shown in the screenshot above, the search filtered the list of the executed queries, by finding the ones which contain the “production” word, and highlighted it everywhere in the Details pane. Furthermore, the date period can be set, in the top right corner, for which results should be displayed.
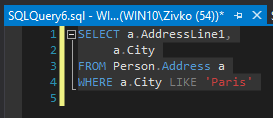
From this window, the code of the query can be viewed in the new query window, if there is a need to change some part of the code. With a double–click on the desired query, it will open as a new query window in SSMS ready for editing.
To see how the logs are saved and what information can be obtained from them, go to the location where the logs are saved. By default, this location is: C:\Users\USER\AppData\Local\ApexSQL\ApexSQLComplete\ExecutedQueries
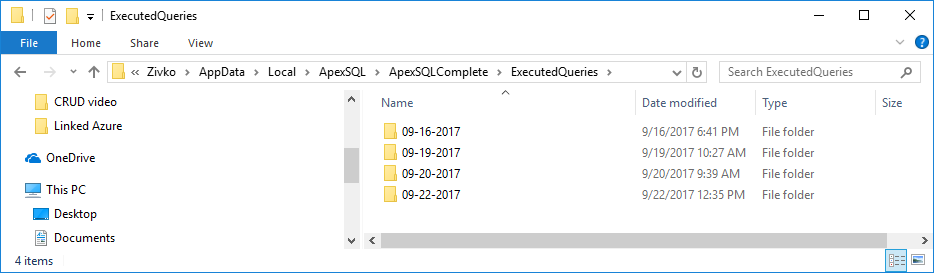
At this location, choose the desired date for which logs need to be seen and in this example, the 09-22-2017 date is selected. In this folder, there is a file named ExecutedQueries.xml, and it contains logs of all queries which have been executed for the mentioned date. If it’s opened with Internet Explorer, the following information will be presented.
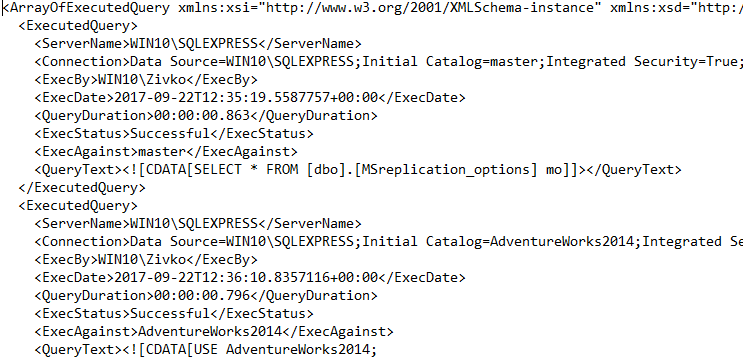
From this .xml file, all information related to this particular query can be seen, which are also provided in the Query history window, like the query execution time, for which database was the query executed, server name, the user which executed the query, etc.
March 4, 2015


