


Indexes are paramount to achieving good database and application performance. Poorly designed indexes and a lack of the same are primary sources of poor SQL Server performance. This article describes an approach for SQL server index optimization to increase query performance.
An index is a copy of information from a table that speeds up retrieval of rows from the table or view. Two main characteristics of an index are:
- Smaller than a table – this allows SQL Server to search the index more quickly, so when a query hits a particular column in our table and if that column has an index on it, the SQL Server can choose to search the index rather than searching the entire table because the index is much smaller and therefor it can be scanned faster
- Presorted – this also means that search can be performed faster because everything is already presorted, for example, if we’re searching for some string that starts with the letter “Z” the SQL Server is smart enough to start the search from the bottom of an index because it knows where the search criteria is going to be
Available index types
In general, SQL Server supports many types of indexes but in this article, we assume the reader has a general understanding of the index types available in SQL Server and will only list the most used ones that have the greatest impact on SQL Server index optimization. For a general description of all index types, please see Index Types.
- Clustered – determines how the data is written to the disk e.g. if a table doesn’t have a clustered index, the data can be written in any order making it hard for SQL Server to access it, however, when present, a clustered index sorts and stores the data rows of the table or view usually in alphabetical on numerical order. So, if we have an identity field with a clustered index on it then the data will be written on the disk based on the number of that identity. There can only be one way in which SQL Server can order the data physically on the disk and therefore we’re only allowed one clustered index per table. One important thing to know is that a clustered index is automatically created with a primary key
- Nonclustered – this is the most common type in SQL Server and typically more than one on a single table. The maximum number of nonclustered indexes vary depending on the SQL Server version but the number goes e.g. in SQL Server 2016 as high as 999 per table. Unlike clustered indexes, which actually organize data, the nonclustered index is a bit different. The best analogy would be to think of it as a book. If we go to the very end of a book, usually there is an indexing part that basically has a huge list of topics and it points on which page they’re on. A typical scenario is the reader finds a topic/term and it points e.g. to a chapter on page 256. If the reader goes to that page, the searched information is right there. The point is to find it very fast without the need to go through the entire book searching for the content and this is basically what nonclustered index does
- Columnstore – converts data that is normally stored in columns and converts it into rows and in doing so it allows the database engine to search more quickly. They are the standard for storing and querying large data warehousing fact tables
- Spatial – this type of index provides the ability to perform certain operations more efficiently on spatial objects like geometry and geography. They are somewhat uncommon outside of specialized GIS systems
- XML – as the name applies, this index type is associated with the XML data type and they convert XML data into a tabular format and again this allows them to be searched more quickly. There’re two types: primary and secondary. A primary index is a requirement in order to create secondary
- Full-text – provides efficient support for sophisticated word searches and English language queries in character string data. This is the only type of index that allows us to run a different type of query and to find words that sound like each other or different forms of a word, so for example if a singular word search is performed, the index would also return a plural of the specified word
Creating an index
So, now that we gained some basic knowledge and a general idea of what indexes do let’s see a few SQL Server index optimization real-world examples using SQL Server Management Studio (SSMS) to create an index and most importantly take a closer look at some performance benefits of indexes.
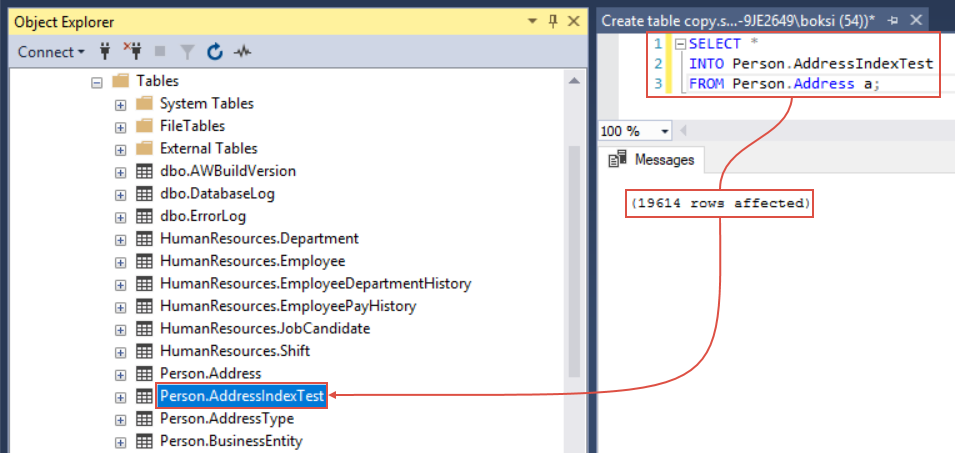
First things first, we need to create a testing table and insert some data into it. The following example uses the AdventureWorks2014 database but you’re welcome to use any database also because we’re creating a new table that can be deleted afterward. Execute the code from below to create a brand new copy of the existing Person.Address table:
SELECT *
INTO Person.AddressIndexTest
FROM Person.Address a;
We just created a new table called Person.AddressIndexTest and by executing the query from above we’ve copied 19614 records into it but unlike the source table the newly creaded one has absolutely no indexes on it:
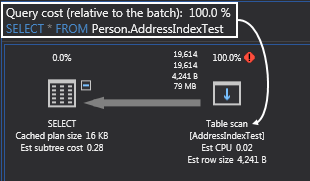
Because this table has no indexes on it, if we open up ApexSQL Plan and look at the execution plan, it’s going to be a full table scan (scan all rows from the table), row-by-row bringing back the result that is specified in the Select statement:
Now, let’s query the new data in SSMS and see how we can analyze information returned in the results grid. Before analyzing queries and performance testing it’s recommended to use the below code:
CHECKPOINT;
GO
DBCC DROPCLEANBUFFERS;
DBCC FREESYSTEMCACHE('ALL');
GO
The CHECKPOINT and DBCC DROPCLEANBUFFERS are just creating a clean system state. It’s going to remove as much as possible from the cache because when doing performance testing it’s highly advisable to start with a clean state of memory each time. This way we know that any changes in performance weren’t caused by some data being cached that hasn’t been cached on previous runs.
The other part of the same query will be the Select statement in which we’re returning one column from the table we just created. But wrapped around the Select statement, let’s add the SET STATISTICS IO to display information regarding the amount of disk activity generated by T-SQL statements itself. So, when we execute the statement, it will of course return some data but the interesting part is when we switch over to the Messages tab where we can see how the table was queried under the hood:
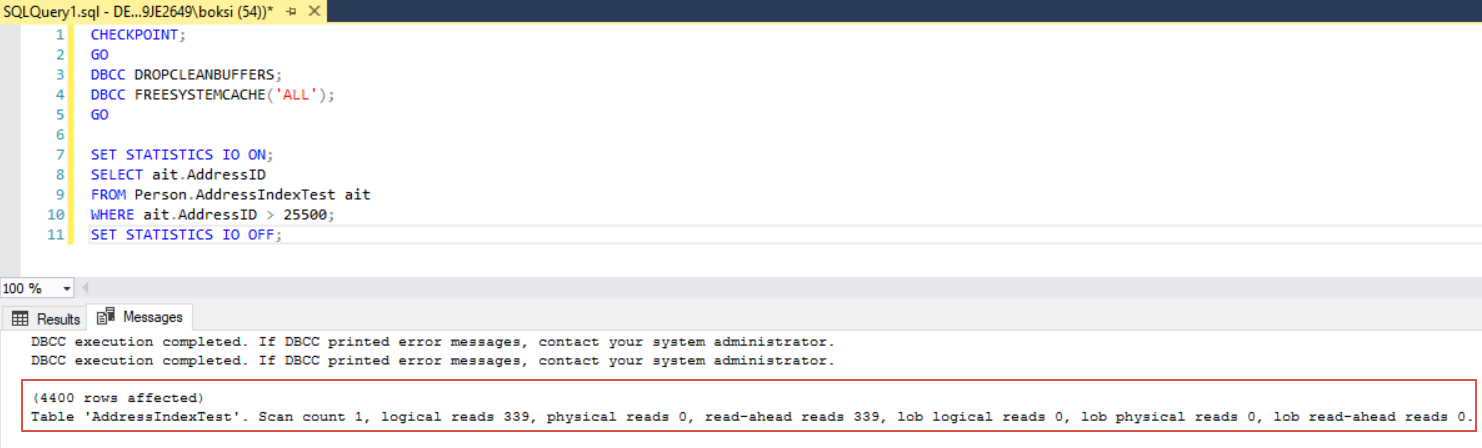
As it can be seen, there’re 339 logical reads and the same amount of read-ahead reads. What it’s important here is to know what those two represents:
- read-ahead reads – is when the data is read from the disk and then copied into memory (cache) AKA disk activity
- logical reads – is when the data is read from the cache AKA memory activity
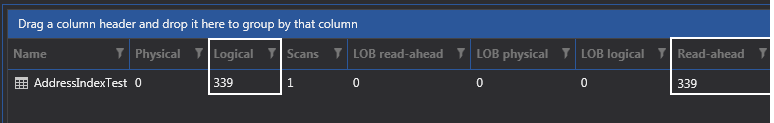
An easier way to get the same information is to get the actual execution plan of just the Select statement in ApexSQL Plan, and then switch to I/O reads tab. Remember to always clear the cache or you might see zero read-ahead reads. Why? Because we already executed the Select statement once in SSMS and after that SQL Server accesses data from the cache:
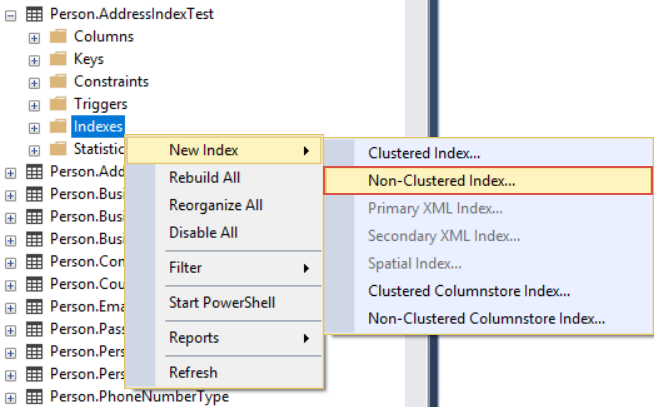
Now, let’s create an index on the table and then run the same query again and there should be a lower number of reads. The easiest way to create an index is to go to Object Explorer, locate the table, right-click on it, go to the New index, and then click the Non-Clustered index command:
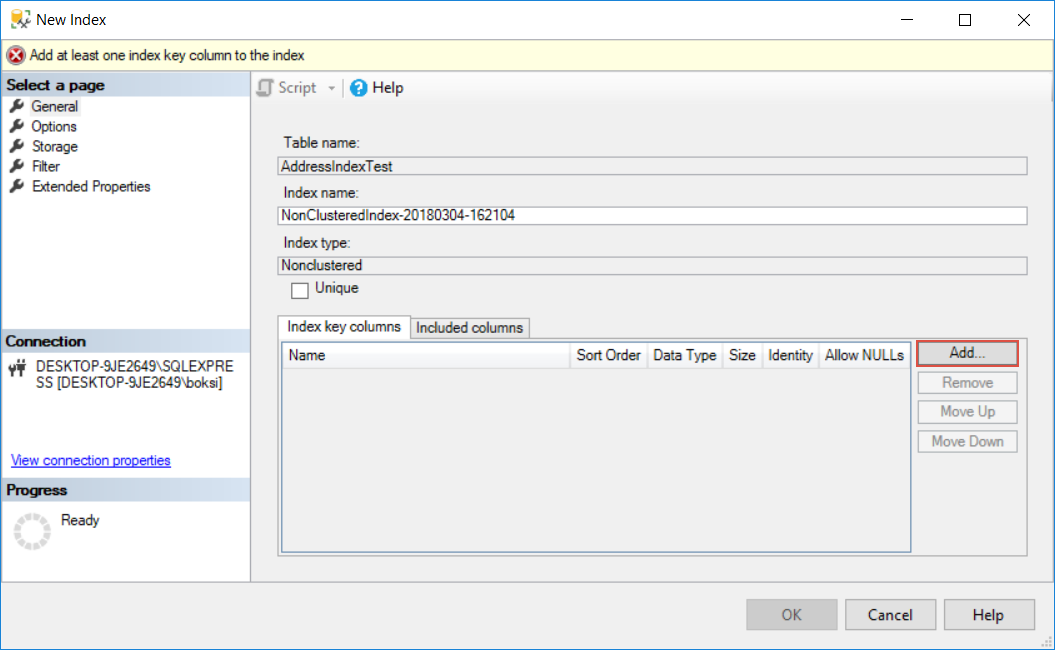
This will open the New index window in which we can click the Add button on the lower right to add a column to this index:
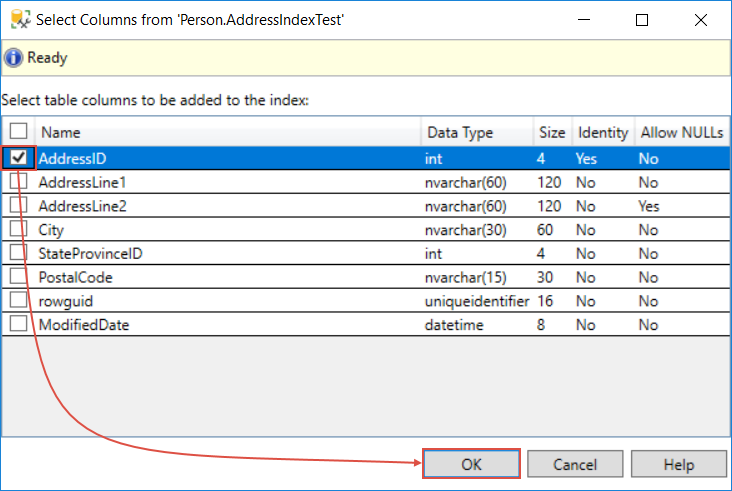
For this example, we only need one column to be added to the index and that’s the one from the Select statement. So, select the AddressID table column and hit the OK button to proceed:
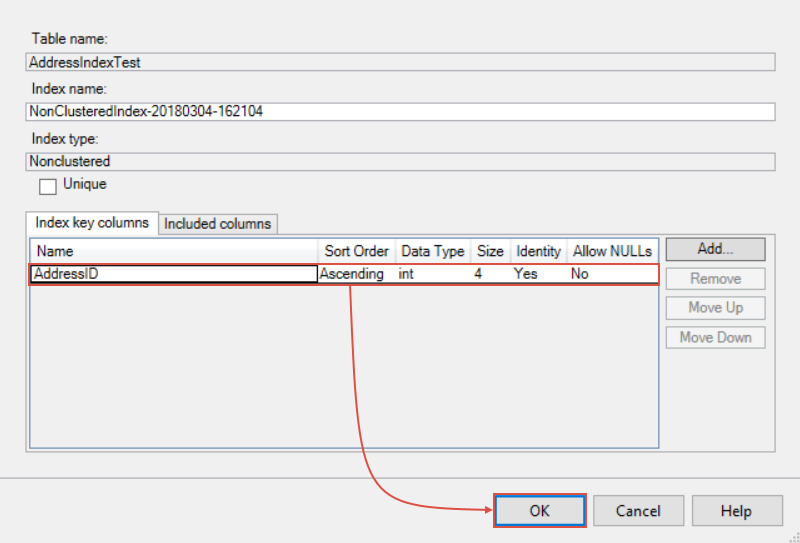
Back to the new index table, Under the Index key columns tab, there should be the column we just added (if it’s not, switch the page and it will appear). SQL Server has automatically chosen a name for the index and if needed this can be changed but why not go with the defaults. To complete the index creation just hit the OK button one more time:
Once this is done, let’s run the exact same query and look at the I/O reads again:
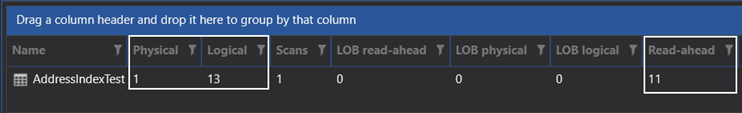
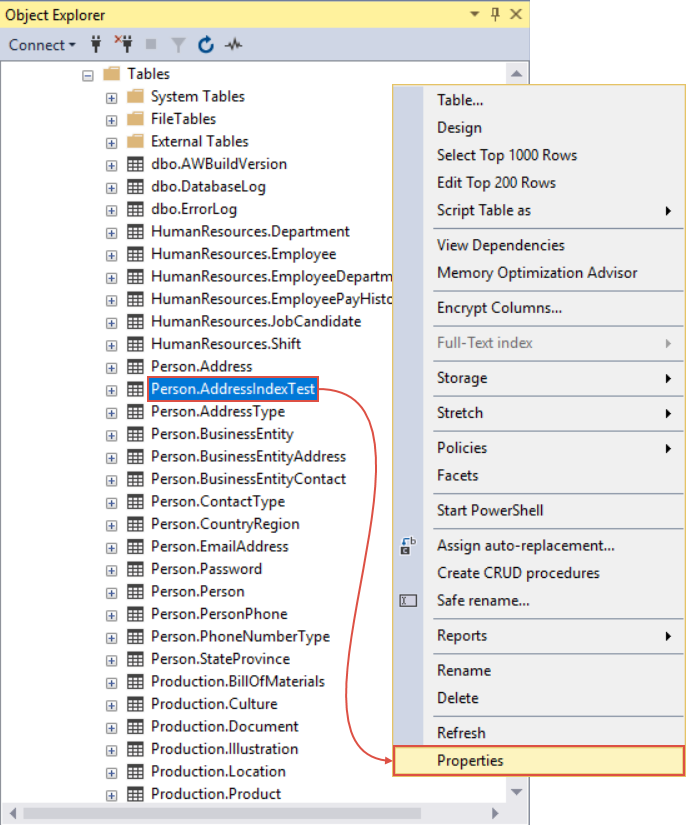
This time, we got 1 physical, 13 logical, and 11 read-ahead reads which is significantly less than before. Notice that we got the exact same result back with much less disk activity and access to the cache within the addition of a single index and SQL Server fulfilled the request of this query but did significantly less work. Why is that? Well, we can look at a few things to explain this. First, let’s go to Object Explorer, right-click our table and choose Properties:
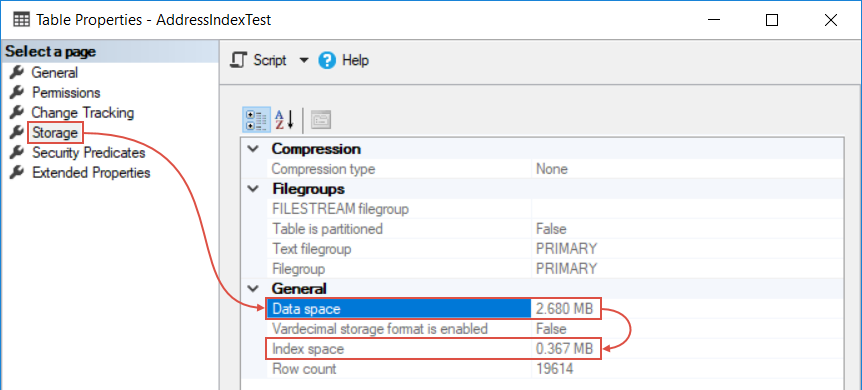
This will open the table properties window and if we switch over to Storage page, there’s a Data space item which represents the size of the data in the table in megabytes (in this case 2.68 MB) and the first time when we ran the query without the index, SQL Server had to read every row in the table but the index is only 0.367 MB. So, after we created the index, SQL Server could execute the same query by only reading the index because in this case the index is 7.3x smaller than the actual table:
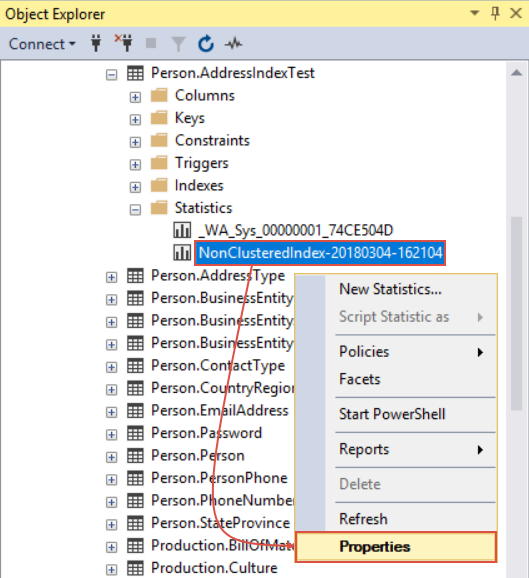
We can also look at the statistics. Statistics play a significant role in the database performance world. Once the index is created, SQL Server automatically creates statistics. Back to Object Explorer, expand the table, expend the Statistics folder and right-click the statistic with the exact same name as previously created index and choose Properties:
Again, this will open the statistics properties window in which we can switch to Details page under which we can see that the index is broken into different ranges:
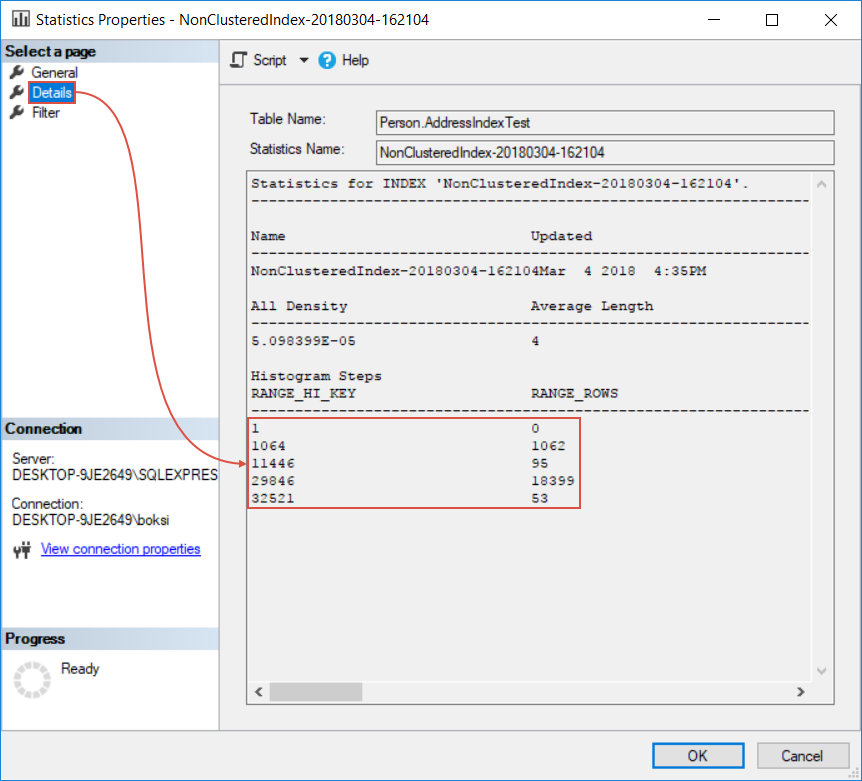
You’ll see hundreds of these ranges in statistics on tables and because of them, SQL Server knows if values searched for are at the very beginning, middle, or end of an index and therefore it doesn’t need to read the entire index. Usually, it will start at some percentage thru and just read to the end of it.
So, these two factors: an index is usually smaller than a table and the fact that statistics are maintained on an index allows the SQL Server to find the particular data we’re looking for by using fewer resources and more quickly. Bear in mind that the indexes provide for a performance increase when the data is being read from a database but they can also lead to a performance decrease when the data is being written. Why? Simply because when inserting data into a table, SQL Server would have to update both the table and the index values increasing the writing resources. The general rule of thumb is to be aware of how often a table is being read vs how often is written to. Tables that are primarily read-only can have many indexes and tables that are written to often should have fewer indexes.
Columnstore index
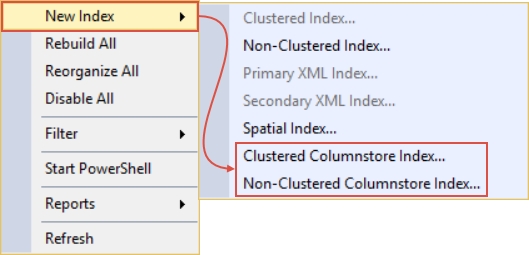
A columnstore index is a technology for storing, retrieving and managing data by using a columnar data format, called a columnstore. Creating a columnstore index is similar to creating a regular index. Expand a table in Object Explorer, right-click on the Index folder and there will be two items: Clustered and Non-Clustered Columnstore Index:
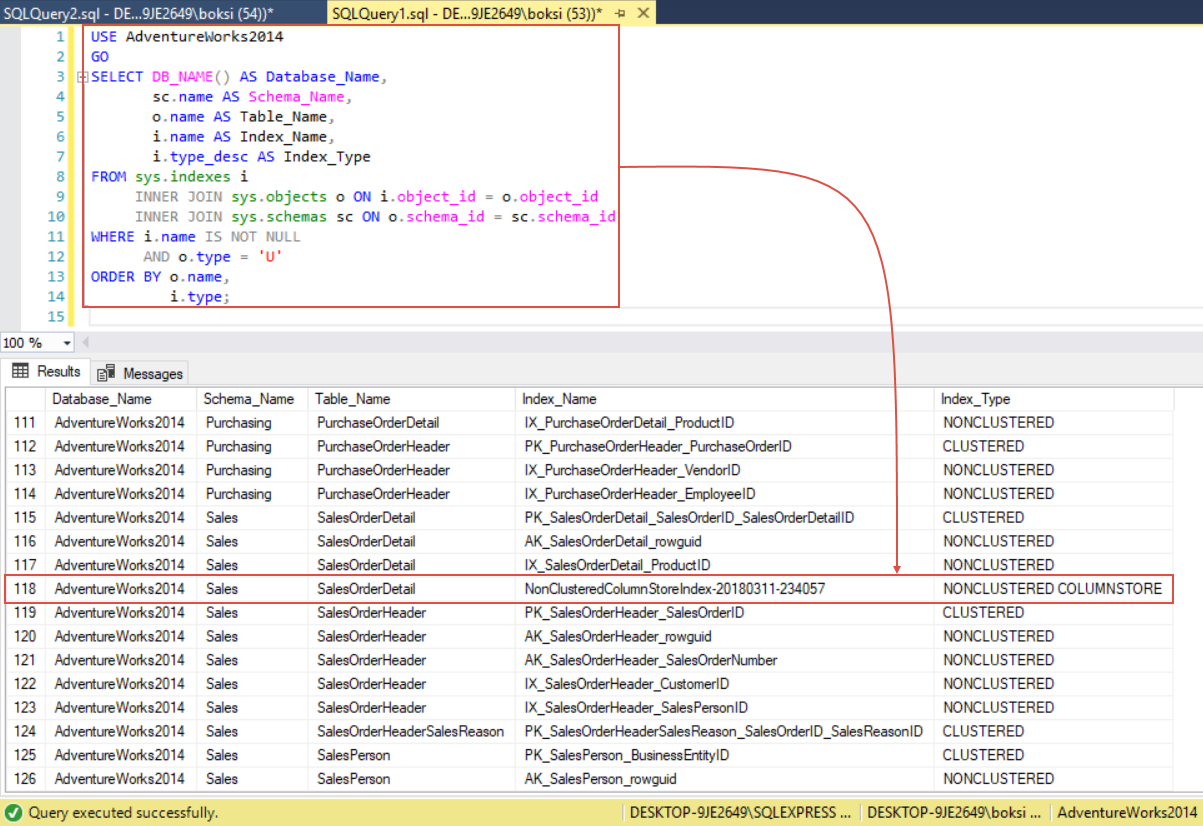
Both commands open up the same new index dialog. So, rather than showing the same process of creating another type of indexes let’s look at an existing Columnstore indexes in our sample database. Now, what I like to do is to run a query from below against a targeted database and it will return a list of all indexes for all user tables from that database:
USE AdventureWorks2014
GO
SELECT DB_NAME() AS Database_Name,
       sc.name AS Schema_Name,
       o.name AS Table_Name,
       i.name AS Index_Name,
       i.type_desc AS Index_Type
FROM sys.indexes i
     INNER JOIN sys.objects o ON i.object_id = o.object_id
     INNER JOIN sys.schemas sc ON o.schema_id = sc.schema_id
WHERE i.name IS NOT NULL
      AND o.type = 'U'
ORDER BY o.name,
         i.type;
The results grid shows the database name, schema name, table name, index name, and most importantly index type. Scrolling down thru the list of indexes find one that says nonclustered columnstore and, as we can see from below example, one is attached to the SalesOrderDetail table:
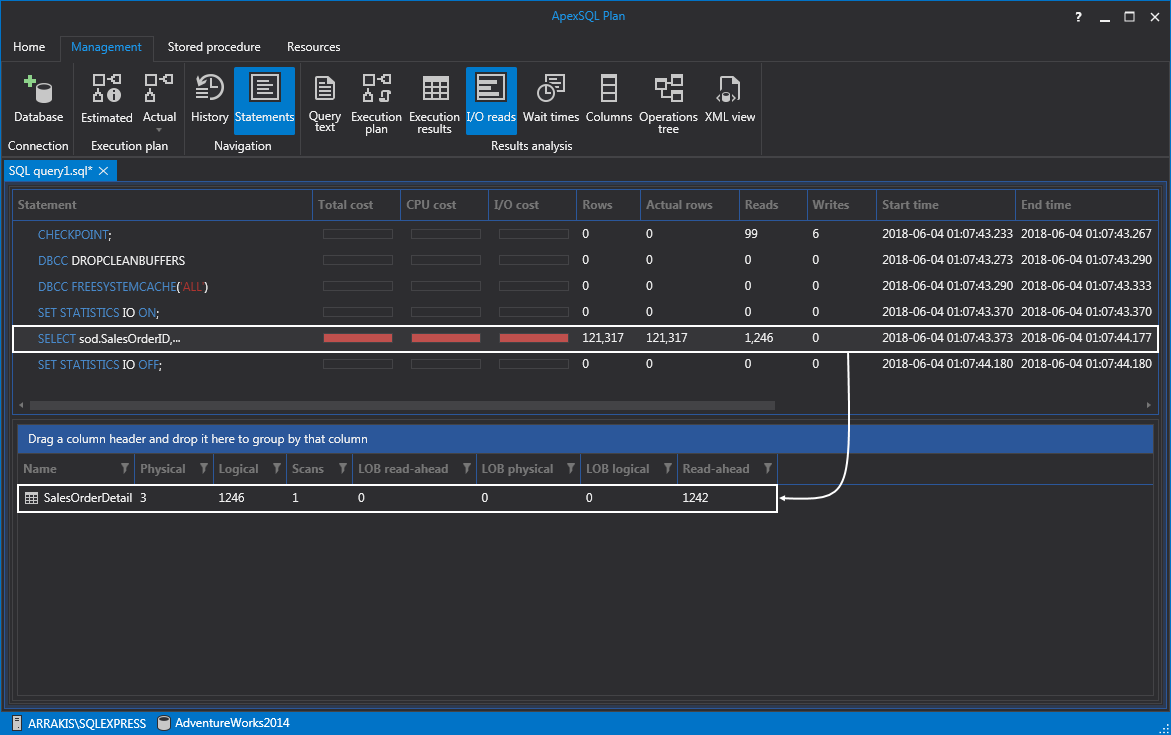
Next, let’s run a Select query in ApexSQL Plan and again remember to add a checkpoint to clean the buffers:
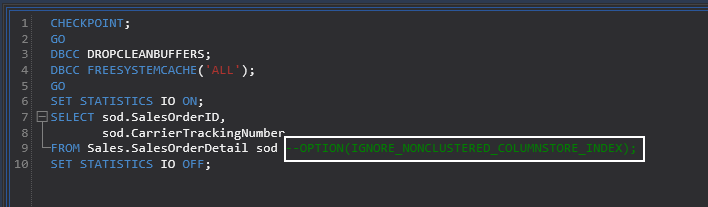
CHECKPOINT;
GO
DBCC DROPCLEANBUFFERS;
DBCC FREESYSTEMCACHE('ALL');
GO
SET STATISTICS IO ON;
SELECT sod.SalesOrderID,
       sod.CarrierTrackingNumber
FROM Sales.SalesOrderDetail sod OPTION(IGNORE_NONCLUSTERED_COLUMNSTORE_INDEX);
SET STATISTICS IO OFF;
The first time we’ll run it with the option to ignore the columnstore index. The idea behind this is to see what kind of performance we get when we ignore the index and as shown below we got: scan count of 1, 1246 logical reads, 3 physical reads, and 1242 read-ahead reads:
We already know what those I/O reads represent but let’s just comment out the option to ignore the columnstore index and see what happens:
So, this time the index will be used and instead of disk and memory activity we got previously, this time we got 218 lob logical reads, 3 lob physical reads, and 422 lob read-ahead reads:
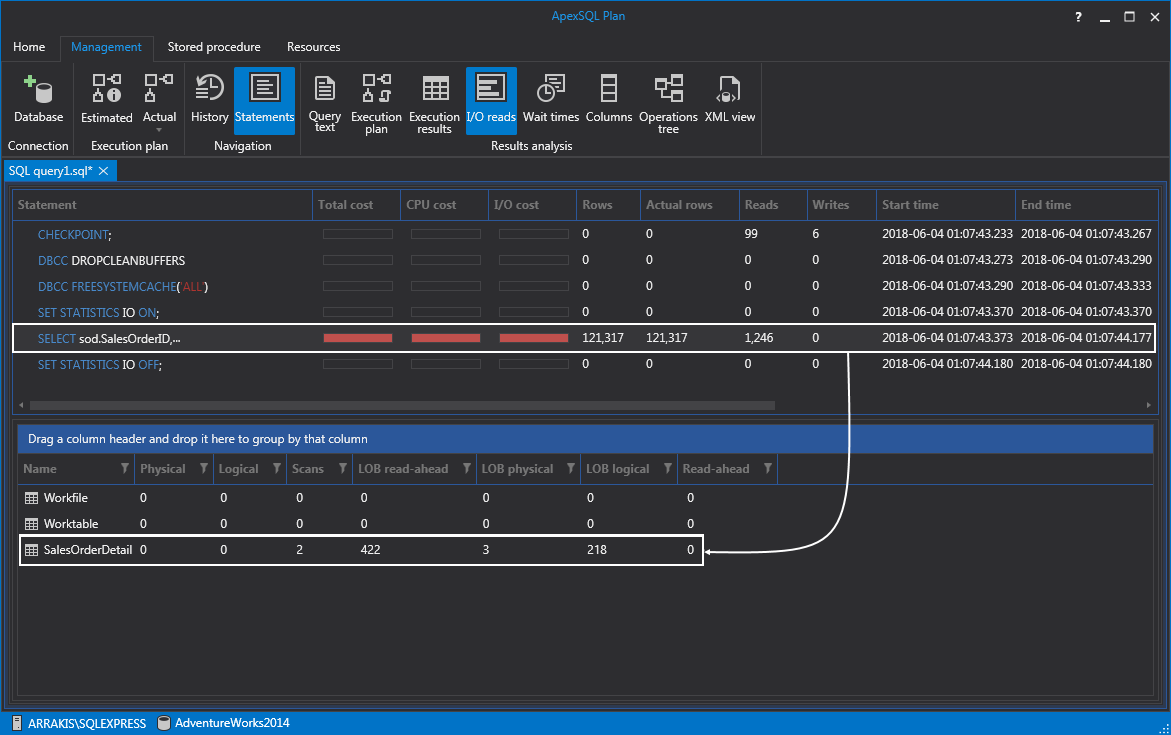
So, we went down from over 1,200 read-ahead reads to about 400 which means SQL Server is doing 66% less work.
- LOB reads – you’ll see those when reading different data types
How does this work? A columnstore index takes data that is typically stored in columns and instead stores it in rows. In this case, we were looking for information stored in two columns: SalesOrderID and CarrierTrackingNumber but the table SalesOrderDetail has 9 additional columns. Without the columnstore index, SQL Server has to read all the details of every row in order to find the two that we specified. But with the columnstore index that data is stored in rows rather than columns and therefore the SQL Server only has to read the appropriate rows and furthermore can ignore a large percentage of the rows which ultimately give us a significant SQL Server index optimization increase by simply causing the SQL Server to do less work.
Explore execution plans
Numbers can be confusing even when we know what they represent. ApexSQL Plan does have a compare option which allows comparing data side-by-side but what I like to do is to explore the execution plans and look at a few things that break things down making it easy to understand what is good and what is bad even for a first-time user.
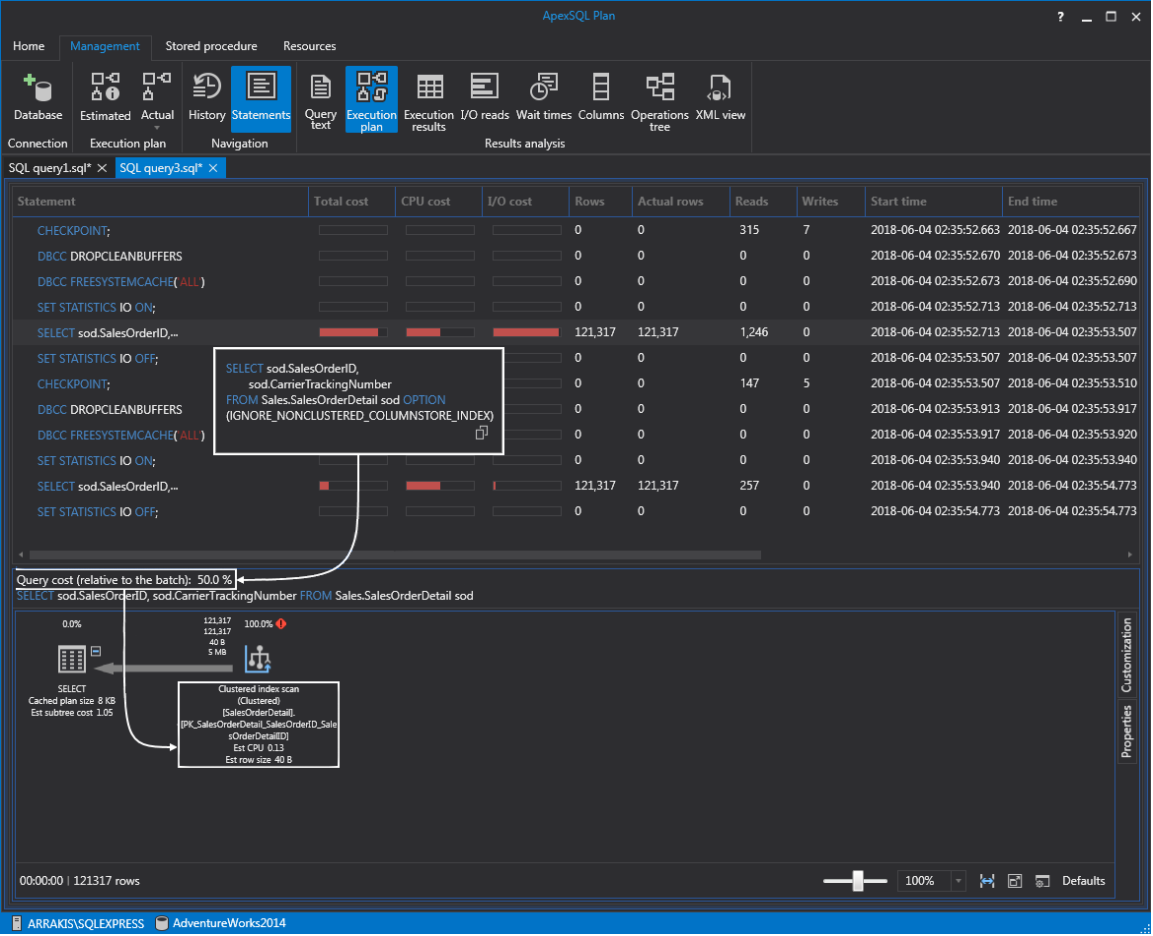
So, what I’d normally do is edit the Query text and execute two Select statements in one query from which one has the option to exclude the index, and the other one is what SQL Server would normally choose to fulfill the request. This way, if we hover the mouse over first Select statement a tooltip will appear showing T-SQL code. As shown below, this one forces the execution plan to ignore the columnstore index. Furthermore, it shows the total query cost relative to the batch which is 50% in this case. Down below we can also see that it’s scanning a clustered index, entirely or only a range:
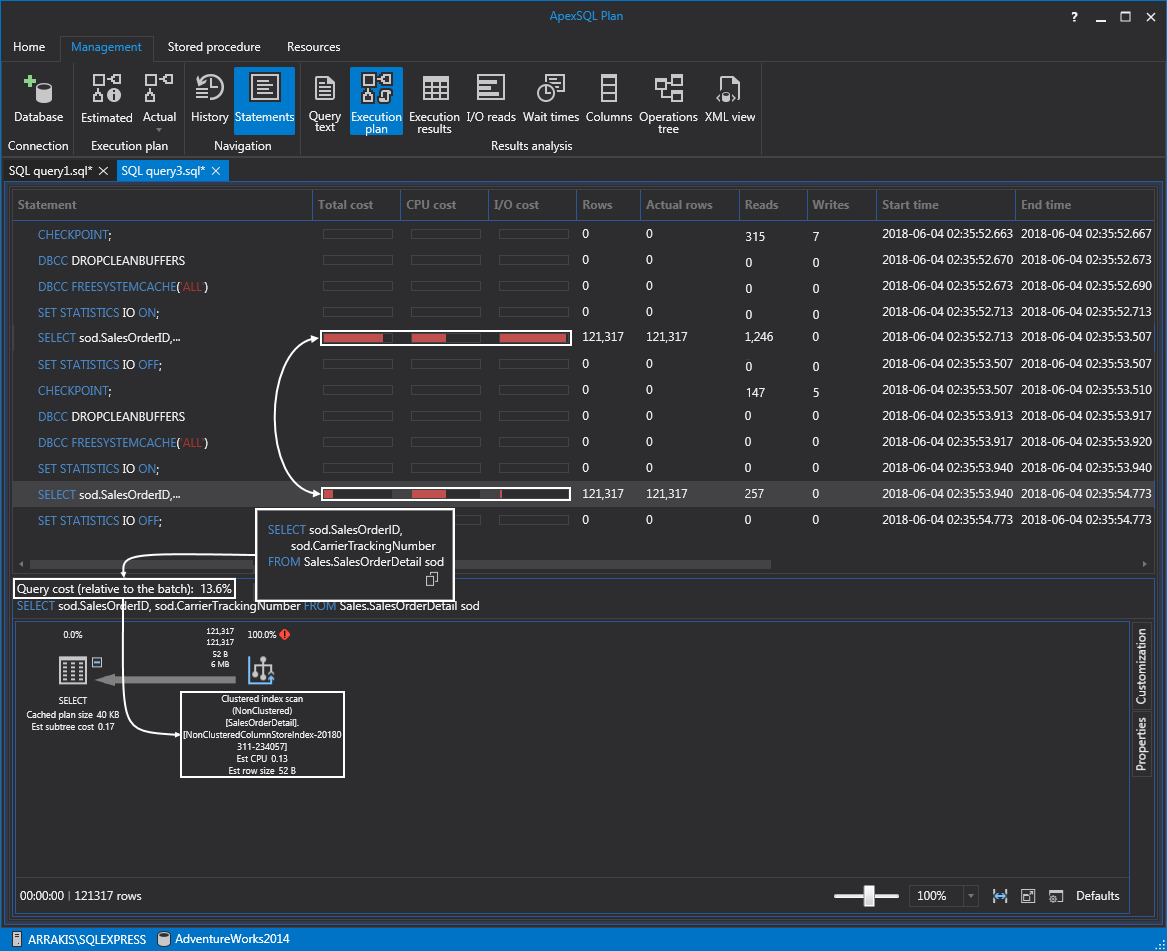
If we move on to a regular Select statement, notice that query cost is only 13.6% which is a decrease of 36.4%. Looking at the execution plan, we can also verify that the columnstore index was used this time. Furthermore, if we just look at the bars representing the visual indicator of the total cost, CPU cost, and I/O cost we can see the performance boost on this query within the presence of a single index:
Columnstore indexes were introduced in SQL Server 2014 with a major limitation when adding a columnstore index on a table, in that the table would become read-only. Luckily, Microsoft has removed this limitation in SQL Server 2016 and starting from this version and newer we have the read-write functionality.
I hope this article has been informative for you and I thank you for reading.
For more information about on SQL Server index tuning, please see articles on how to optimize SQL Server query performance – part 1 and part 2
Useful links
March 19, 2018


