


Introduction
As database administrators, we obsess over a few things, things we don’t compromise on. One of them is SQL Server availability. We may use several tools, scripts, and/or configurations, in addition to constant oversight, to ensure that the database is always available. We sometimes even go that extra mile to ensure availability, because we know it is easier to ensure a database is available than deal with the outcome of unavailability. In this post, let us look at some of the easiest ways to ensure availability.
Getting Started
SQL Server availability can be ensured using quite a few techniques. We will focus on one that utilizes collecting data on a dedicated server. Let’s call this the central repository. We shall store the data here, and project the service availability reports from here. The periodic collection of server trends is vital to measure system health. This can be done using T-SQL, or PowerShell, or even a third-party tool. Let’s look at the various available options, and also schedule a job to monitor availability across multiple servers.
Server Availability overview
We usually associate the word “availability”, with pinging a service and measuring the server and service uptime. SQL Server availability reports come in handy when we have to examine the downtime of a certain application. We correlate this information with overall application performance to get a holistic idea of the availability and performance and determine the overall health of a system. This is important because, even though a server may be up and the service is running, the application may have latency or such issues due to various other factors.
Creating a SQL Server availability report that collects data from the event logs and generates trends of availability is one approach, but I personally believe that the Event Viewer is for troubleshooting. Querying a large chunk of the logs with an event ID might not be the best way to measure availability.
Gathering the required details across multiple servers may seem like a daunting task. Following are some of the categories of server availability or service availability failures:
- Accidental stoppage of the SQL service
- Server failure
- SQL instance error
- Memory-related error
- High CPU Usage
- Full disk
- Bad queries
- Network-related issues
The aforementioned categories may contribute to availability issues.
There’s now no doubt that an availability report is necessary. An availability report:
- Helps us understand if our servers are meeting their reliability objectives
- Track the trends over a specified duration
- Look for information concerning only a small subset of the servers we monitor
- Grade the servers based on performance
- Identify the areas of improvement, based on the vitals of the servers
- Get information based on the OS and the applications the servers are running
How to measure SQL Service availability
Let’s now get straight to the point. We’re going to try measuring the availability using, at various times, the following tools/technologies:
- SQL Error Log
- T-SQL – Using DMVs and T-SQL Scripting
- T-SQL & SMO (SQL Server Management Objects) – PowerShell Scripts, and T-SQL
- SQL Server Dashboard
First, we’ll look at the ways to integrate T-SQL and SQL Server Management Objects (SMO) to gather the required availability metrics, without the use of third-party tools. Then we’ll also look at several aspects of the script maintenance.
Method 1: Measuring SQL Service availability using the SQL Server Error Log
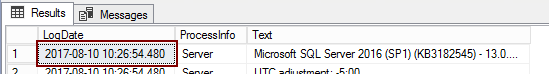
Troubleshooting issues with a SQL instance can be done using the SQL Error Log. The error log can be very helpful to detect/troubleshoot any current or potential problem areas, including automatic recovery messages (particularly if an instance of SQL Server has been stopped and restarted), kernel messages, or other server-level error messages.
In the screenshot below, the LogDate column shows the start-up time of the SQL server
sp_readerrorlog 1
Method 2: Measuring SQL Service availability by querying the tempdb
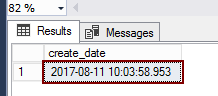
Whenever a database instance is started up, the TempDb is created. Therefore, we can check the creation time of the tempdb to figure out the startup time of the instance.
SELECT create_date FROM sys.databases WHERE NAME = 'tempdb'
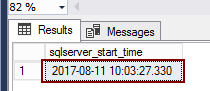
Method 3: Use DMV sys.dm_os_sys_info and sys.dm_exec_sessions
select sqlserver_start_time from
sys.dm_os_sys_info
SELECT login_time FROM sys.dm_exec_sessions WHERE session_id = 1
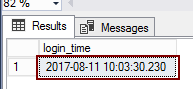
This is the third method to get details on the database availability. Now, when you compare the instance startup time derived from methods 2 and 3, you’d see that the time in method 2 would be a little after that of method 3. The reason is that the creation of the tempdb happens after the SQL server restarts; not much can happen without tempdb in action. Therefore, the time obtained using the DMV query would be a little before that of the tempdb method.
Method 4: Measuring SQL Service availability using PowerShell
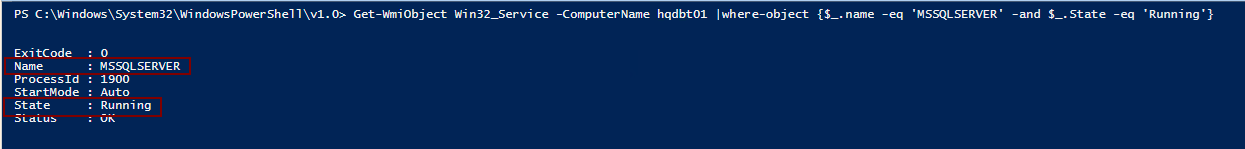
Let’s now try to use PowerShell to get the availability information. We’d run the following command to see if the SQL service is running or not. In the output, the State column shows whether the service is running or not.
Get-WmiObject Win32_Service -ComputerName $computer |where-object {$_.name -eq 'MSSQLSERVER' -and $_.State -eq 'Running'}
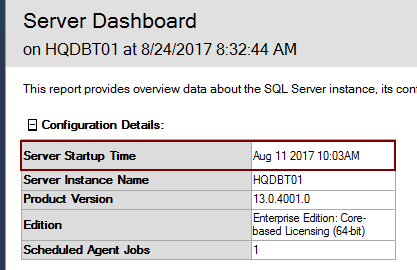
Method 5: Measuring SQL Service availability using the Server dashboard report
We could browse the SQL Server standard reports to view the server dashboard report. This report has the server startup time information. To view this report:
- Right click SQL Instance in SSMS
- Select Reports -> Standard Reports -> Server Dashboard
Implementation
Now that we’ve reviewed some options for polling a SQL Server and collecting data on availability let’s go ahead and leverage some of these technologies to create a custom availability monitoring and reporting system.
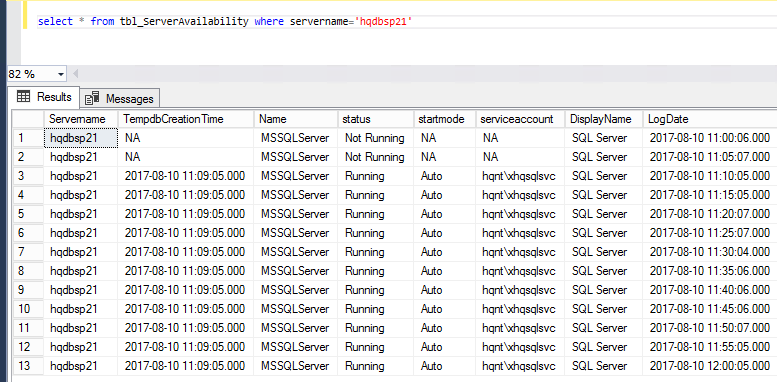
With that, let’s set up our monitoring server, and create a custom table that would hold the necessary data.
CREATE TABLE tbl_ServerAvailability
(
  Servername NVARCHAR(20) NULL,
  TempdbCreationTime nVARCHAR(20) NULL,
  Name nVARCHAR(50) NULL,
  status nVARCHAR(90) NULL,
  startmode VARCHAR(20) NULL,
  serviceaccount VARCHAR(20) NULL,
  DisplayName VARCHAR(50) NULL,
  LogDate DATETIME NULL
)
Let’s now create a PowerShell function, and call it using the SQL Agent, or schedule it using the Windows Task Scheduler so that it runs the script periodically, across multiple SQL Servers. We’ll trigger this from the central server.
Let’s follow the steps below to achieve the desired result.
-
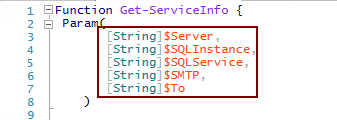
Declare the required variables. The input file lists the SQL Server, SQL Instance, and SQL Service we want to monitor; let’s add these as parameters. We also need to define the host name of the SMTP server in the environment, and the list of recipients. Here are the parameters:
- ServerName – Name of the Server
- SQLInstance – The Default or Named Instance
- SQLService – The default (MSSQLSERVER) or named instance (MSSQL$<Instance Name>)
- SMTP – The hostname of the SMTP server in the environment (your Exchange team would be able to give you this information)
-
To – List of recipients list for email delivery. We have specified one recipient. If you want more, declare the parameter as [String[]]$To. Now, each of the email addresses should be a separate string, like so:
$To = ‘email1@domain.com’, ‘email2@domain.com’, ‘email3@domain.com’…
-
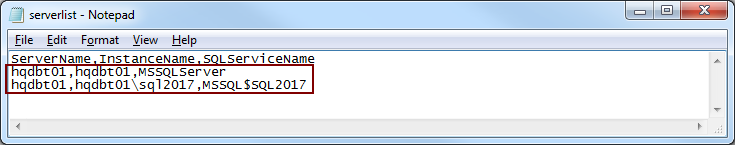
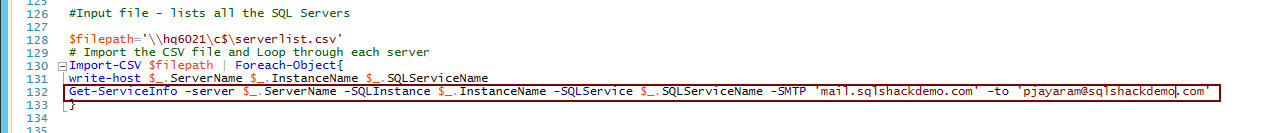
Import the server list into a variable so that we can iterate through the list. You’d notice that this is a CSV.
-
Check for the server connectivity, the status of the SQL service, and query the creation time of the tempdb.
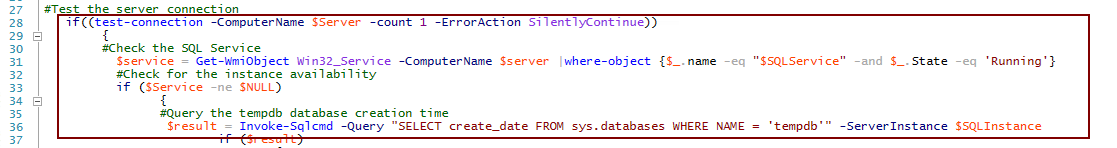
-
Create an email body based on the output from the last step.
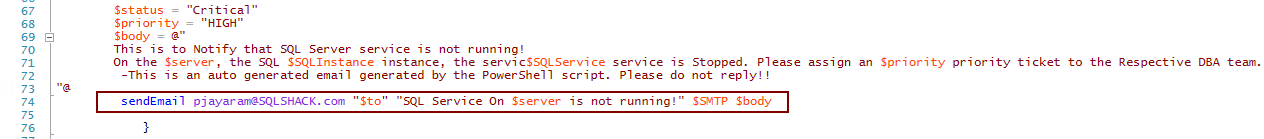
-
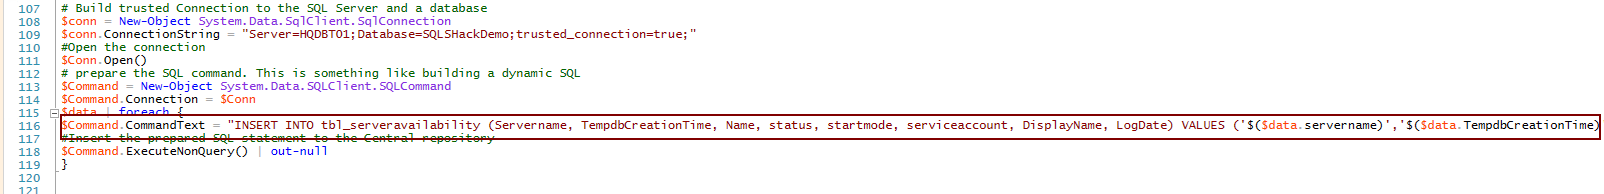
Prepare SQL for the insertion of the gathered data into the central repository.
-
Loop through server names imported at Step 2. The parameters SMTP and To is fed from the input
The complete script is placed at Appendix (A)
Let’s now suppose that we schedule this script to run very frequently—say every 15 minutes. We can count the number of times the database information was logged, and perform some rough math. Suppose we run it every 15 minutes; there would be 4 logs per server, per hour. If the server was not even reachable on say, the third run, it would mean that there were only 3 logs made in that hour. Therefore, we could surmise that the server/service was available only for 45 minutes in that hour. As the data is stored in the central repository, the reports can be generated, and the metrics can be compared against the defined SLA.
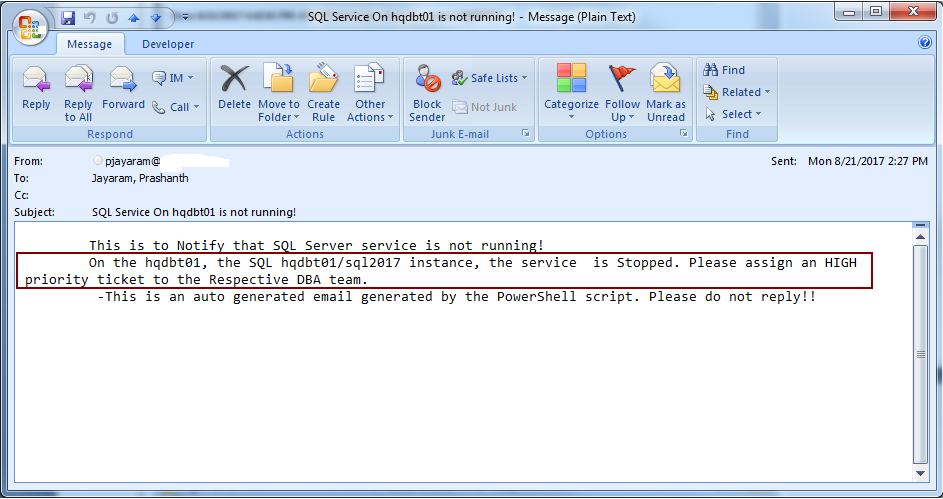
Email alert notification:
References
Appendix (A)
PowerShell script to get the availability information.
Function Get-ServiceInfo {
 Param(
       [String]$Server,
       [String]$SQLInstance,
       [String]$SQLService,
       [String]$SMTP,
       [String]$To
    )

# Get the current datetime
$logdate = (Get-Date).ToString('MM/dd/yyyy hh:mm:ss')

#Function created to send email

Function sendEmail
 {
    param($from,$to,$subject,$smtp,$body)
    [string]$receipients="$to"
    $body = $body
    $body = New-Object System.Net.Mail.MailMessage $from, $receipients, $subject, $body
    $smtpServer = $smtp
    $smtp = new-object Net.Mail.SmtpClient($smtpServer)
    $smtp.Send($body)

 }

#Test the server connection
   if((test-connection -ComputerName $Server -count 1 -ErrorAction SilentlyContinue))
        {
        #Check the SQL Service
          $service = Get-WmiObject Win32_Service -ComputerName $server |where-object {$_.name -eq "$SQLService" -and $_.State -eq 'Running'}
          #Check for the instance availability
          if ($Service -ne $NULL)
                {
                #Query the tempdb database creation time
                 $result = Invoke-Sqlcmd -Query "SELECT create_date FROM sys.databases WHERE NAME = 'tempdb'" -ServerInstance $SQLInstance
                        if ($result)
                                {
                                  Write-Host "tempdb creation time is $($result.create_date) SQL connection to $SQLInstance"
                                    $crdate=$($result.create_date)
                                    $props += New-Object PSObject -Property @{
                                    Servername = $server
                                    name =  $service.name
                                    tempdbCreationTime=$crdate.ToString('MM/dd/yyyy hh:mm:ss')
                                    Status = $service.Status
                                    startmode = $service.startmode
                                    state = $service.state
                                    serviceaccount=$service.startname
                                    DisplayName =$service.displayname
                                    LogDate=$logdate
                                    }
                                }
              }
          else
            {
                $props += [pscustomobject]@{
                Servername = $server
                tempdbCreationTime='NA'
                name =  'MSSQLServer'
                Status = 'Not Running'
                startmode = 'NA'
                state = 'NA'
                serviceaccount='NA'
                DisplayName ='SQL Server'
                LogDate=$logdate}

        $status = "Critical"
        $priority = "HIGH"
        $body = @"
        This is to Notify that SQL Server service is not running!
        On the $server, the SQL $SQLInstance instance, the servic$SQLService service is Stopped. Please assign an $priority priority ticket to the Respective DBA team.
         -This is an auto generated email generated by the PowerShell script. Please do not reply!!
"@
         sendEmail pjayaram@sqlShack.com "$to" "SQL Service On $server is not running!" $SMTP $body

            }

    }

    else
        {
                $props += [pscustomobject]@{
                Servername = $server
                tempdbCreationTime='NA'
                name =  'SQL Server'
                Status = 'Server Not Responding'
                startmode = 'NA'
                state = 'NA'
                serviceaccount='NA'
                DisplayName ='NA'
                LogDate=$logdate}

        $status = "Critical"
        $priority = "HIGH"
        $body = @"
        This is to Notify that SQL Server is not responding!
        The $server is not responding . Please assign an $priority priority ticket to the Respective DBA team.
         -This is an auto generated email generated by the PowerShell script. Please do not reply!!
"@
        sendEmail pjayaram@appvion.com "$to" "SQL Service On $server is not running!" $SMTP $body

        }
#maintain the output of columns in a specific order

$data=$props|select-object servername,name,tempdbCreationTime,status,startmode,serviceaccount,Displayname,logdate

# Build trusted Connection to the SQL Server and a database
$conn = New-Object System.Data.SqlClient.SqlConnection
$conn.ConnectionString = "Server=HQDBT01;Database=SQLSHackDemo;trusted_connection=true;"
#Open the connection
$Conn.Open()
# prepare the SQL command. This is something like building a dynamic SQL
$Command = New-Object System.Data.SQLClient.SQLCommand
$Command.Connection = $Conn
$data | foreach {
$Command.CommandText = "INSERT INTO tbl_serveravailability (Servername, TempdbCreationTime, Name, status, startmode, serviceaccount, DisplayName, LogDate) VALUES ('$($data.servername)','$($data.TempdbCreationTime)','$($data.Name)','$($data.status)','$($data.startmode)','$($data.serviceaccount)','$($data.DisplayName)','$($data.LogDate)')"
#Insert the prepared SQL statement to the Central repository
$Command.ExecuteNonQuery() | out-null
}


}


#Input file - lists all the SQL Servers

$filepath='\\hq6021\c$\serverlist.csv'
# Import the CSV file and Loop through each server
Import-CSV $filepath | Foreach-Object{
write-host $_.ServerName $_.InstanceName $_.SQLServiceName
Get-ServiceInfo -server $_.ServerName -SQLInstance $_.InstanceName -SQLService $_.SQLServiceName -SMTP 'mail.sqlshackdemo.com' -to 'pjayaram@abc.com'
}
August 29, 2017


