


The purpose behind creating SQL indexes on database tables is to enhance the performance of the queries that read data from the base table by speeding up the data retrieval processes. But these transactional tables are not static and changing very frequently over time. These changes that are performed on the database table include adding new records, modifying or deleting the existing records. As these changes should be replicated to the related table indexes, the table index will become fragmented over time.
SQL Server Index Fragmentation Overview
There are two main types of SQL index fragmentation; Internal and External Fragmentation. The Internal Fragmentation is caused by the inserting a new record or updating an existing record with values that do not fit in the current free space in the data page and result with splitting the page into two pages to fit the new value. In this case, the SQL Server Engine will move about 50% of the data from the current page to the new data page that is generated from the split operation, in order to keep the SQL index tree balanced. Internal fragmentation can be caused also by the random delete operations that result in empty space on the data pages. This type of operations leaves the data pages unfilled and results with larger SQL Server index size and slower performance due to the need to read more data pages to retrieve the requested data.
The External Fragmentation is caused when the data pages of the SQL Server index are scattered on the database physical file, due to having the logical order of the SQL Server index does not match the physical order on the underlying disk drive. External fragmentation can be caused by random delete operations that leave a number of the extent pages empty while having the extent itself reserved. This type of fragmentations results in performance degradation, as it will take more time and consume more resources in jumping between the scattered data pages in order to retrieve the requested data from the underlying disk drive.
The reason why we care much about the SQL index fragmentation is that the index that you have created to enhance the system performance, may degrade the performance of your queries after being highly fragmented. Imagine difference in time and number of disk reads between reading a specific number of rows from a healthy SQL index in which the data is stored in contiguous data pages within the database file, and reading the same number of rows from a highly fragmented SQL Server index, in which the data is scattered in noncontiguous data pages within the database file.
If it is found that the table SQL index is fragmented, you need to fix the fragmentation issue by performing SQL Server Index Reorganization or Index Rebuild, based on the SQL index fragmentation percentage. For example, a SQL Server index with fragmentation percentage of less than 30% can be reorganized, where the SQL index with a fragmentation level higher than 30% should be rebuilt.
- Note: Check Maintaining SQL Server Indexes for more information.
You can proactively overcome SQL Server index fragmentation and pages splitting issues by designing the index properly and setting the Fill Factor and pad_index index creation options with the propervalues.
- Note: Check SQL Server Index Operations for more information.
SQL Server Index Fragmentation Report
It is not considered a best practice just to create a SQL index in your database table to take advantages from the data retrieval operation enhancement and leave that SQL Server index forever without continuously monitoring its fragmentation and maintain it.
SQL Server provides us with several methods that can be used to check the SQL index fragmentation percentage.
SQL Server Index Properties
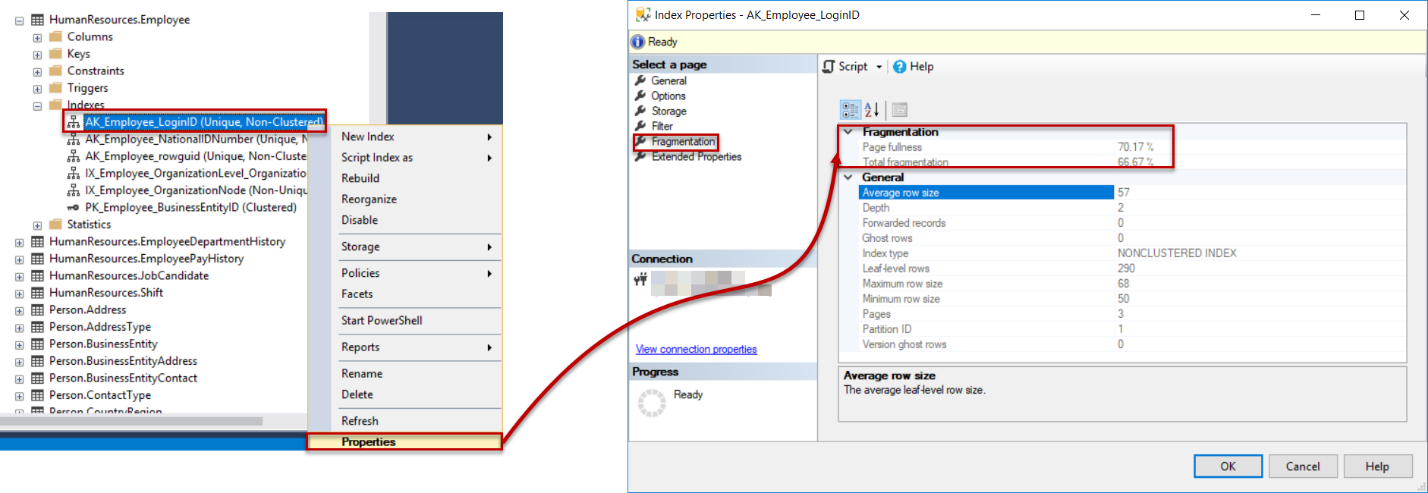
The first method is the Fragmentation page of the SQL Server Index Properties window. Right-click on the index that you need to check and choose the Properties option. From the SQL Server Index Properties page, browse the Fragmentation page, and you will see the index fragmentation percentage and how much the SQL Server index pages are full under the Fragmentation section, as shown below:
In a few steps, you can easily check the SQL Server index fragmentation percentage of the selected index from the index properties window. But what if you need to have an overview of the fragmentation percentage for all table’s indexes or all database tables indexes? In this case, you need to go and check it one by one. As a result, a single work week will not be enough for one database report!
sys.dm_db_index_physical_stats
Another method that can be used to check the fragmentation percentage for the database indexes is querying the sys.dm_db_index_physical_stats dynamic management function, that was introduced the first time in SQL Server 2005, as a replacement for the deprecated DBCC SHOWCONTIG command. It provides information about the size and fragmentation percentage for the database indexes.
In order to get meaningful information about the fragmentation percentage of all indexes under the specified database from the sys.dm_db_index_physical_stats DMF, you need to join it with the sys.indexes DMV, as in the T-SQL script below:
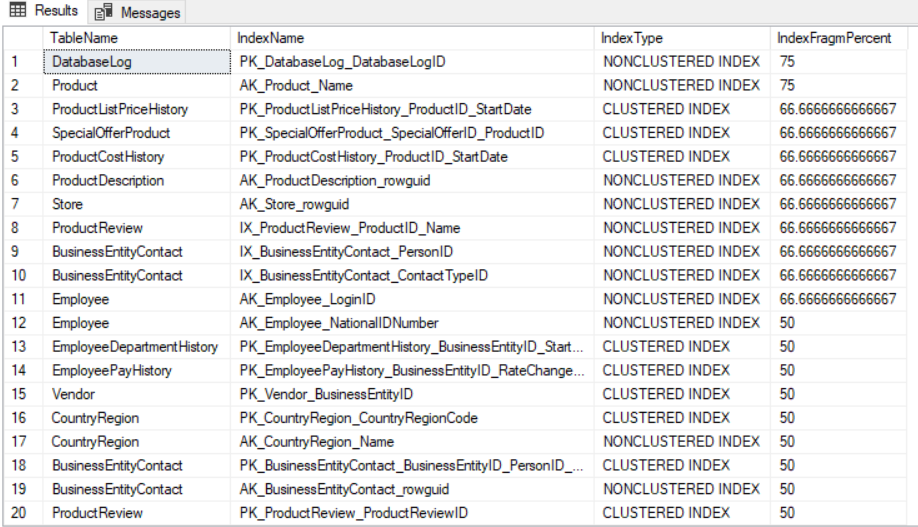
SELECT OBJECT_NAME(Index_Info.OBJECT_ID) AS TableName
  ,Index_Info.name AS IndexName
  ,Index_Stat.index_type_desc AS IndexType
  ,Index_Stat.avg_fragmentation_in_percent IndexFragmPercent
FROM sys.dm_db_index_physical_stats(DB_ID(), NULL, NULL, NULL, NULL) Index_Stat
INNER JOIN sys.indexes Index_Info ON Index_Info.object_id = Index_Stat.object_id
  AND Index_Info.index_id = Index_Stat.index_id
ORDER BY IndexFragmPercent DESC
Based on your SQL development skills, you can perform the filtration that you need to retrieve the SQL index fragmentation on the required scope, with no option to get a summary for the overall instance databases, taking into consideration that the shown data is since the last SQL Server service restart. The result in our case will be like:
SQL Server Index Physical Statistics Standard Report
SQL Server provides us with several standard reports that contain useful statistical information about the selected database. The Index Physical Statistics report, is one of the SQL Server standard reports that returns statistical information about the SQL Server index partitions, fragmentation percentage and the number of pages on each SQL index partition at the database level, since the last SQL Server service restart, with recommendation how to fix the index fragmentation issue, if exists, based on the fragmentation percentage of the SQL Server index.
To view the SQL Server Index Physical Statistics report, right-click on your database, choose Reports -> Standard Reports then select the Index Physical Statistics report, as shown below:

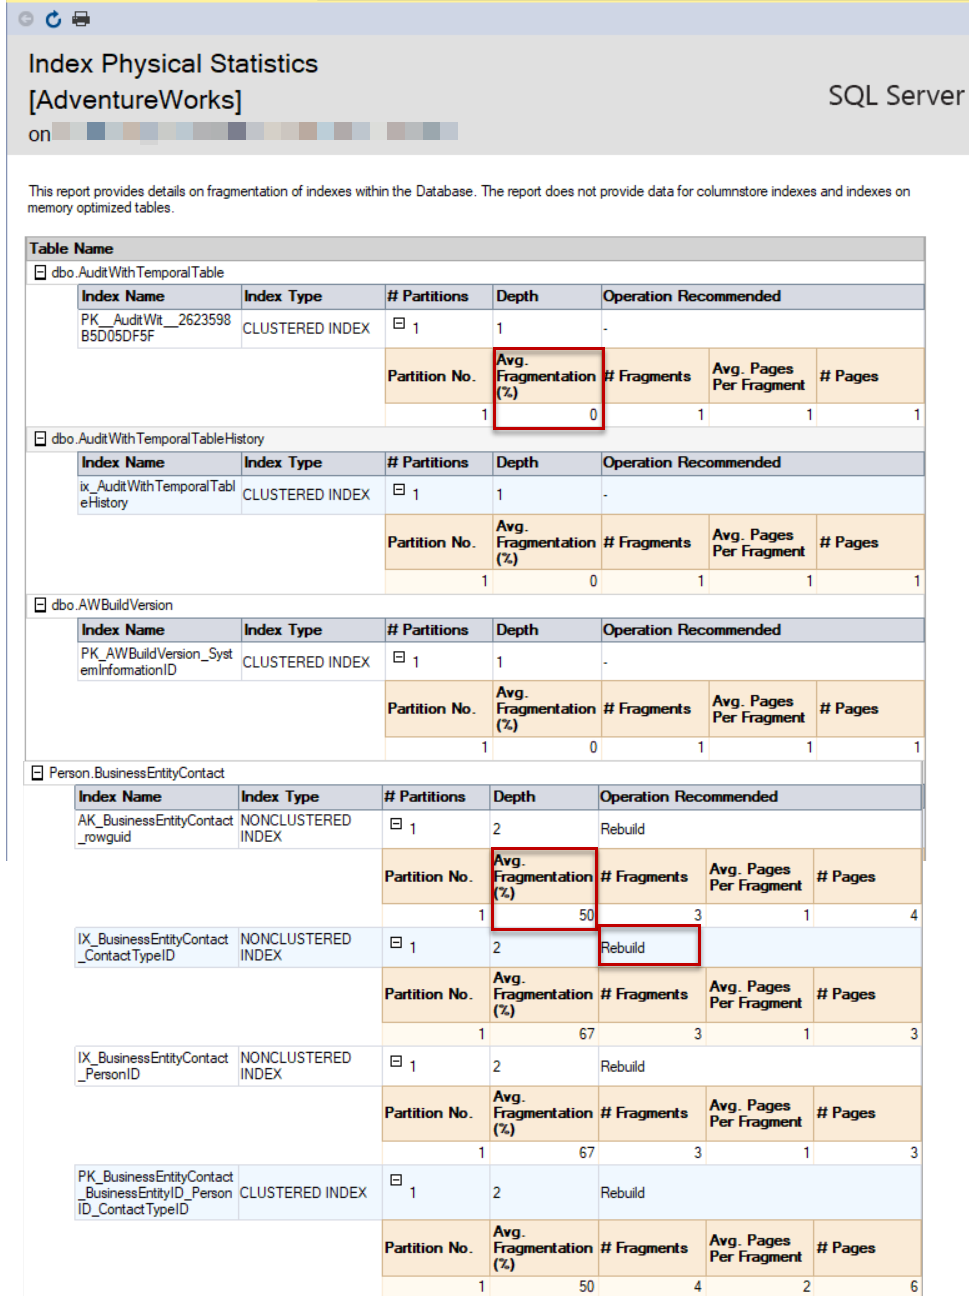
And the generated database level report, that cannot be filtered and needs expanding each table indexes result manually, will be as shown below:
ApexSQL Defrag
ApexSQL Defrag tool is a 3rd party SQL index defragmentation tool that can be easily used to check SQL Server index fragmentation and usage information and perform or schedule the suitable fix for the index fragmentation issue.
From one central location, you can analyze and review the fragmentation and usage information at different levels, including the SQL index fragmentation and usage information at the SQL Server index level, the table level, the database level and finally at the overall SQL Server instance level. It provides us with variant types of filters that can be used to display and maintain only your target indexes.
ApexSQL Defrag allows us also to configure the Fill Factor setting for the table indexes, create alerts for all defragmentation jobs and policies and send Email notification for successful or failed jobs.
The displayed information will provide a good view about the SQL index size and the fragmentation percentage, that will not be affected by any SQL Server service restart or server reboot. This is because this information will be stored in a central repository database for the ApexSQL Defrag tool.
Installing ApexSQL Defrag
ApexSQL Defrag can be easily downloaded from ApexSQL Download Center and installed to your server by following the straight-forward installation wizard, as shown below:
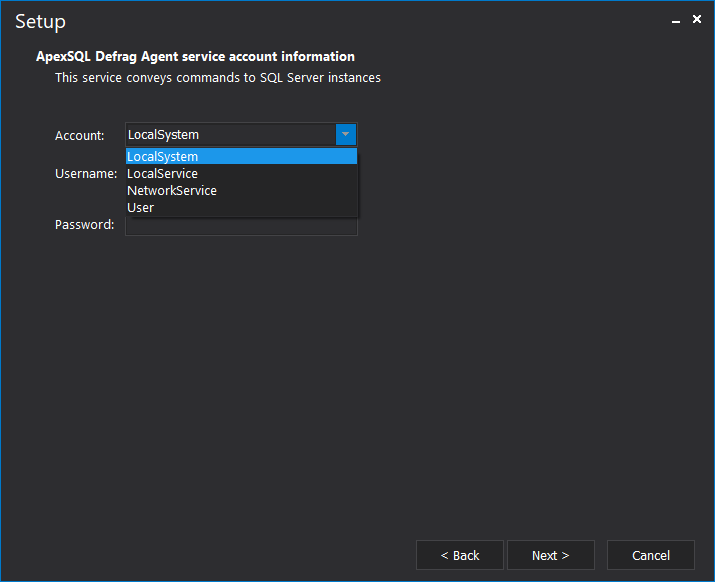
First, you will be asked to specify the service account that will be used as an execution context for the ApexSQL Defrag agent and conveys commands to the SQL Server instance, as follows:
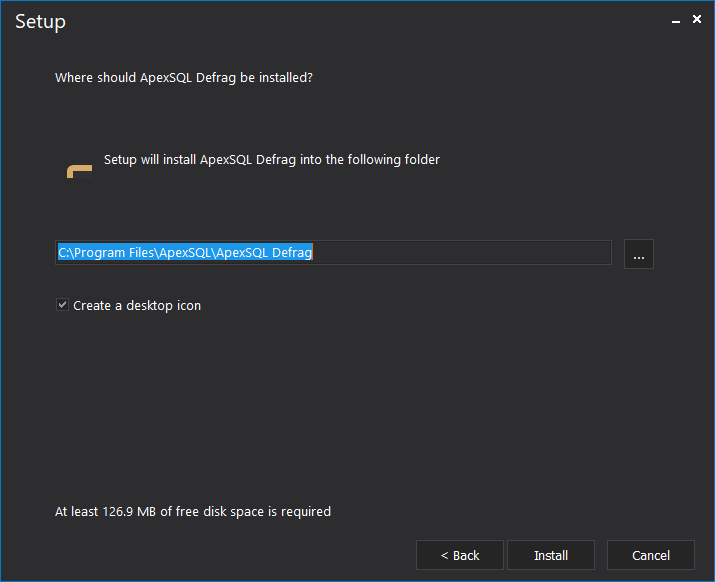
After specifying the ApexSQL Defrag service account, you will be asked to specify where to install the ApexSQL Defrag tool and whether to create a shortcut icon for the tool in the desktop, as shown below:
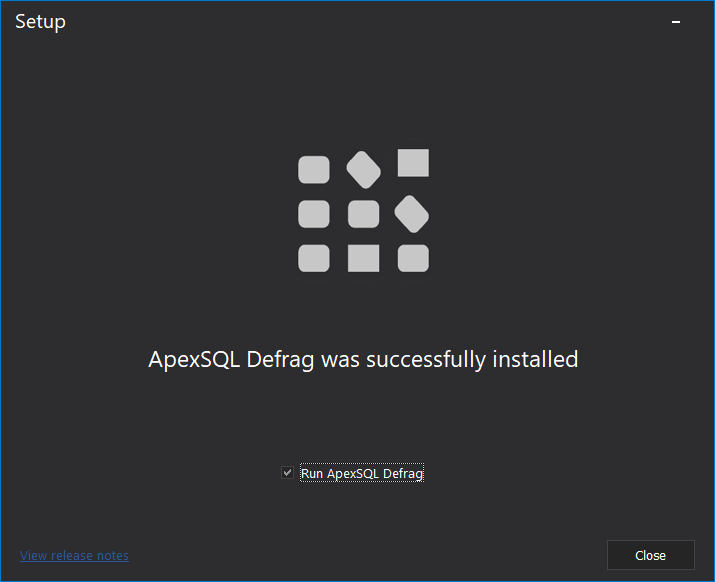
Checking that the provided path contains minimum 127MB free space, ApexSQL Defrag will be installed successfully to your server. And the following notification will be displayed, providing you with the ability to start ApexSQL Defrag directly:
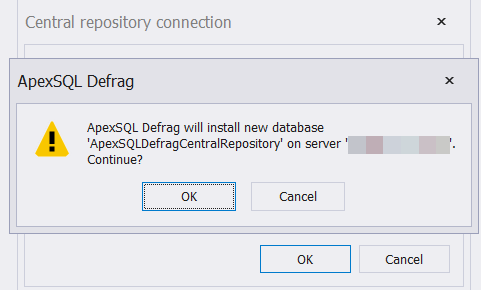
If you run ApexSQL Defrag for the first time, you will be asked to confirm the creation of the central repository database, where these data historical and configuration data will be stored, as follows:
Add New Server
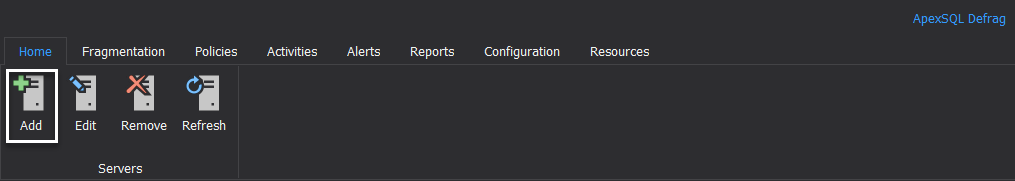
After creating the repository database, ApexSQL Defrag will be started with no SQL instance. To check the SQL index fragmentation percentage on a specific SQL Server instance, you need to add that instance to that tool. To achieve that, click on the Add button, under the Home tab, as shown below:
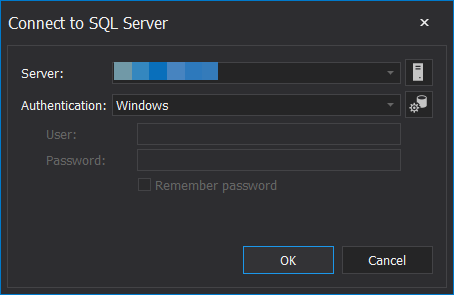
In the Connect to SQL Server window, you will be asked to provide the name of the SQL Server instance that will be used and the credentials that are required to connect to that server, as follows:
SQL Server Index Analysis
When the server is added, you can perform a new check for all SQL index fragmentation information from Fragmentation tab below:
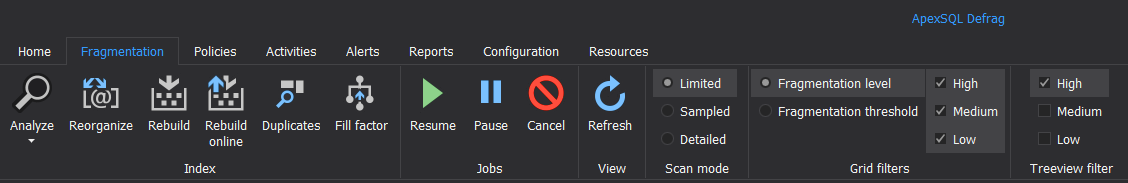
ApexSQL Defrag provides you with the ability to analyze all indexes on that instance based on three modes:
- DETAILED: in which all data and SQL index pages will be read during the scan process
- SAMPLED: in which only 1% of the pages will be read, taking into consideration that the SQL Server index contains more than 10,000 pages
- LIMITED: in which only the pages located at the parent level of b-tree will be read
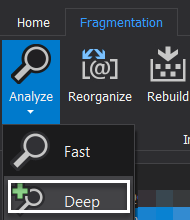
To analyze SQL Server index information from the connected SQL Server instance, click on the Analyze button, under the Fragmentation tab, and choose to perform a Fast or Deep analyzing. We will perform Deep analyzing to get full information, as shown below:
Keep monitoring the progress bar at the bottom side of the tool to check the analyze progress, as follows:

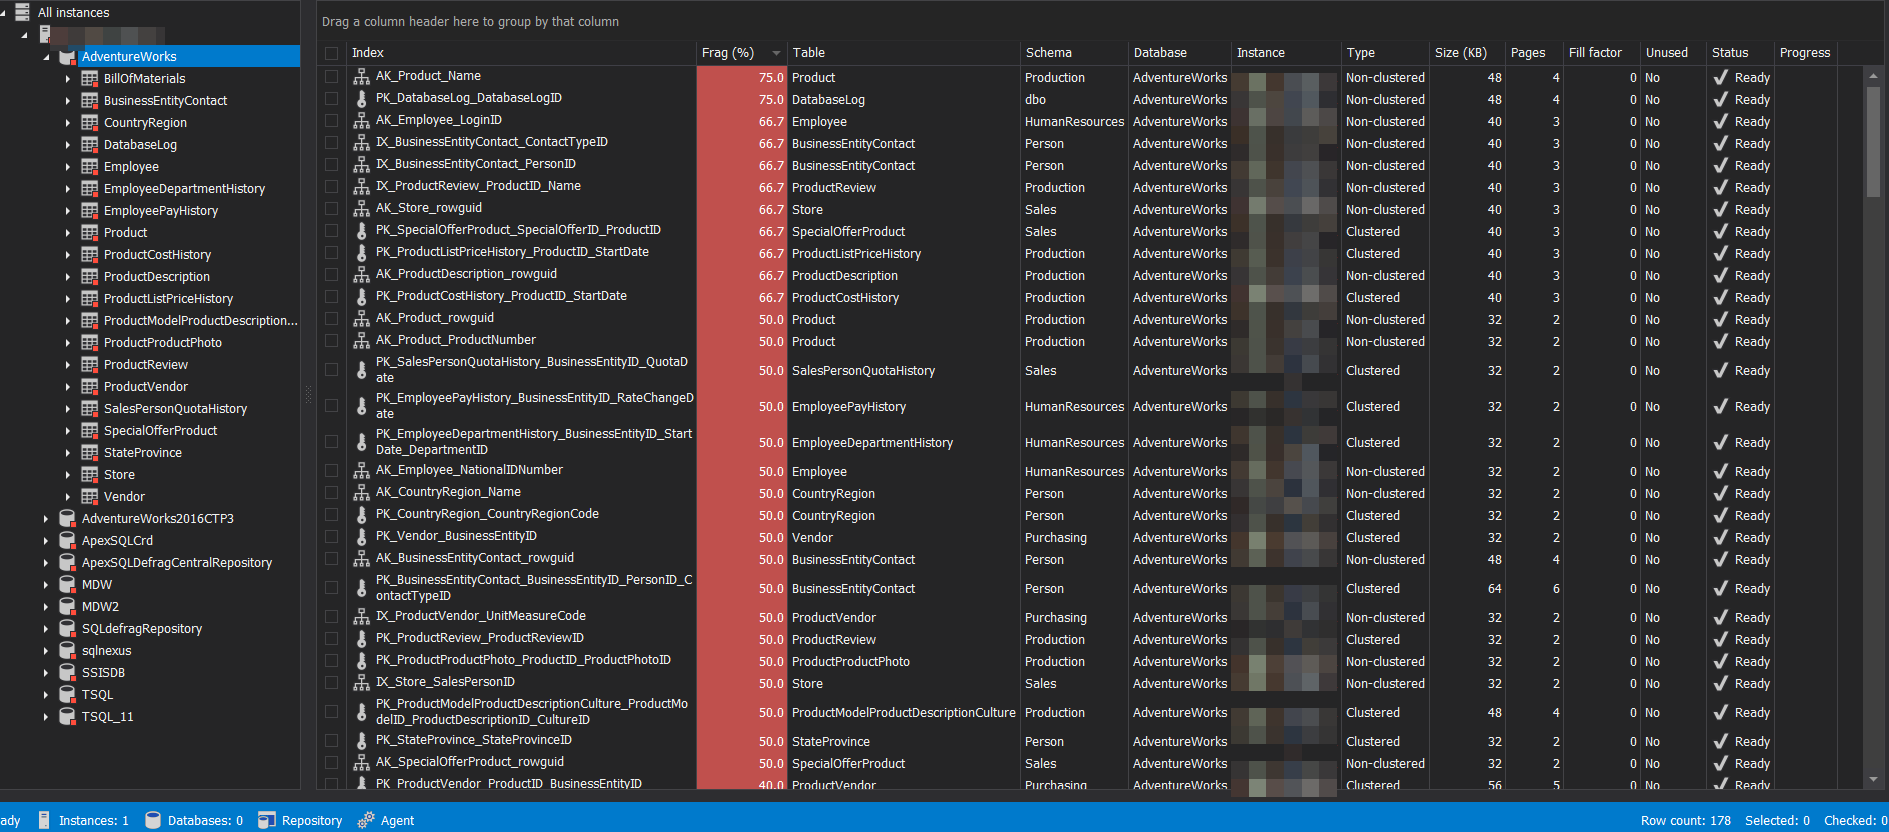
And a comprehensive report, that contains full information about all SQL indexes created under each database of this SQL Server instance, will be displayed as shown below:
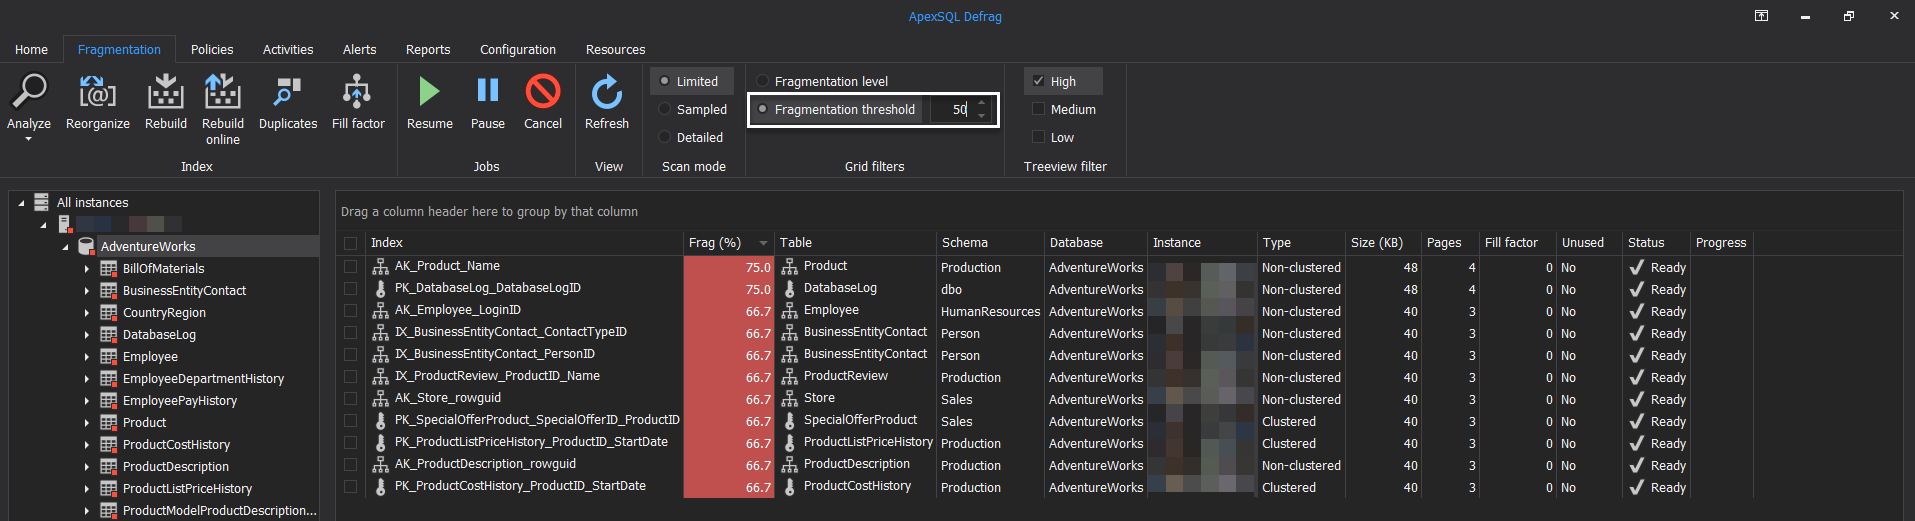
With the ability to dive between the different levels; SQL Server instance, database, table or index, with single click under the same central window, and filter the retrieved result based on a specific fragmentation level or threshold, as shown below:
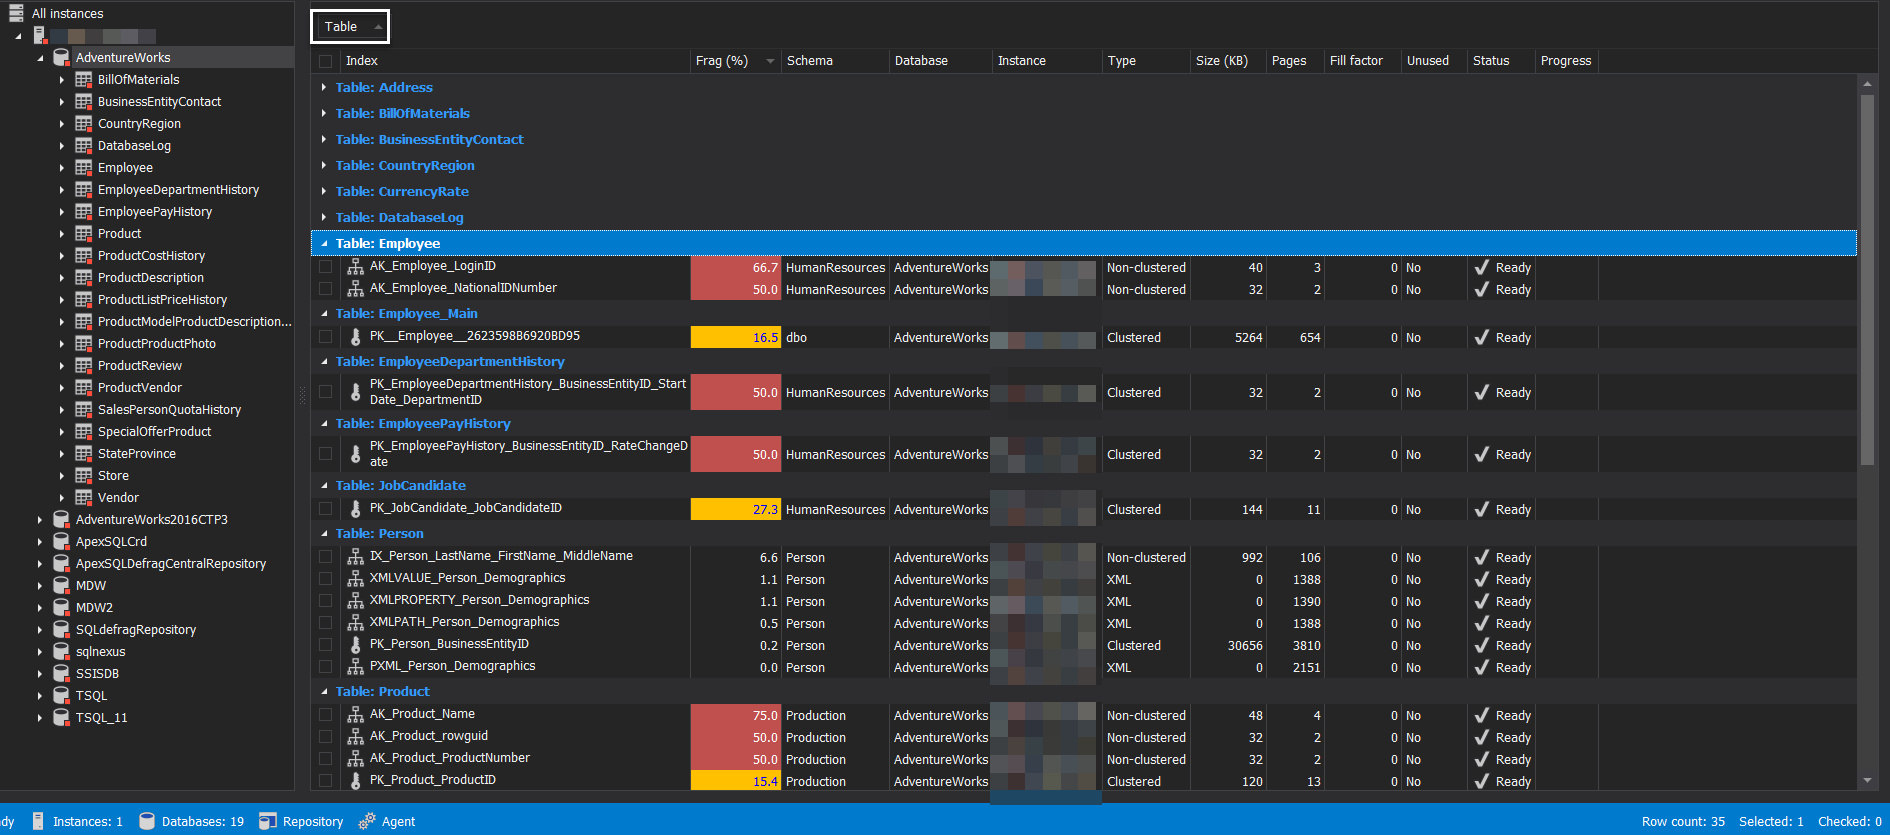
In addition, you can drag any column from the report columns to group the overall report based on that column values, such as the example below, in which we grouped the report data based on the Table name:
ApexSQL Defrag Reports
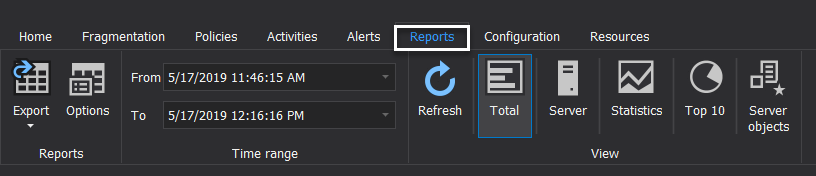
ApexSQL Defrag provides us with a number of reports that shows statistical information about the database indexes. These reports can be configured and checked under the Reports tab below:
The first report is the Total report, that shows a graphical representation for SQL index fragmentation and disk space usage at the selected level. For example, if you click at the instance name, the report will draw the fragmentation percentage graph and the space usage graph at the SQL Server instance level, as below:
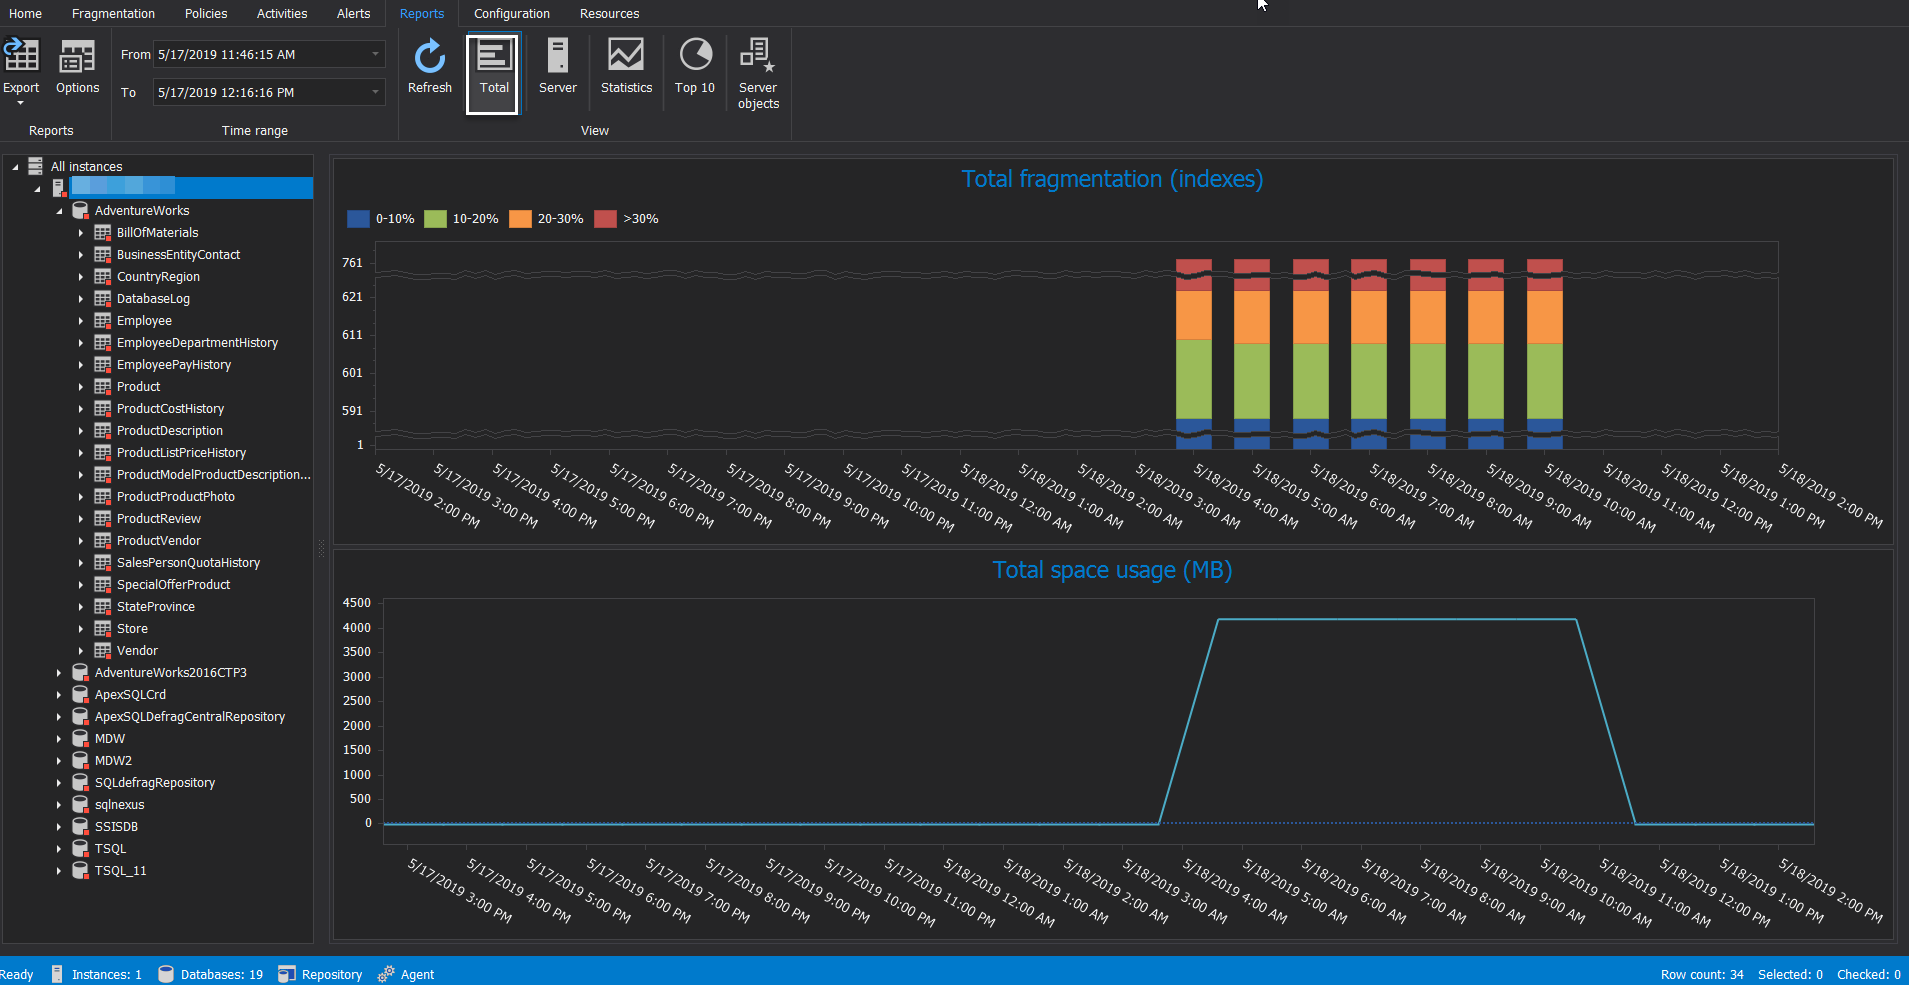
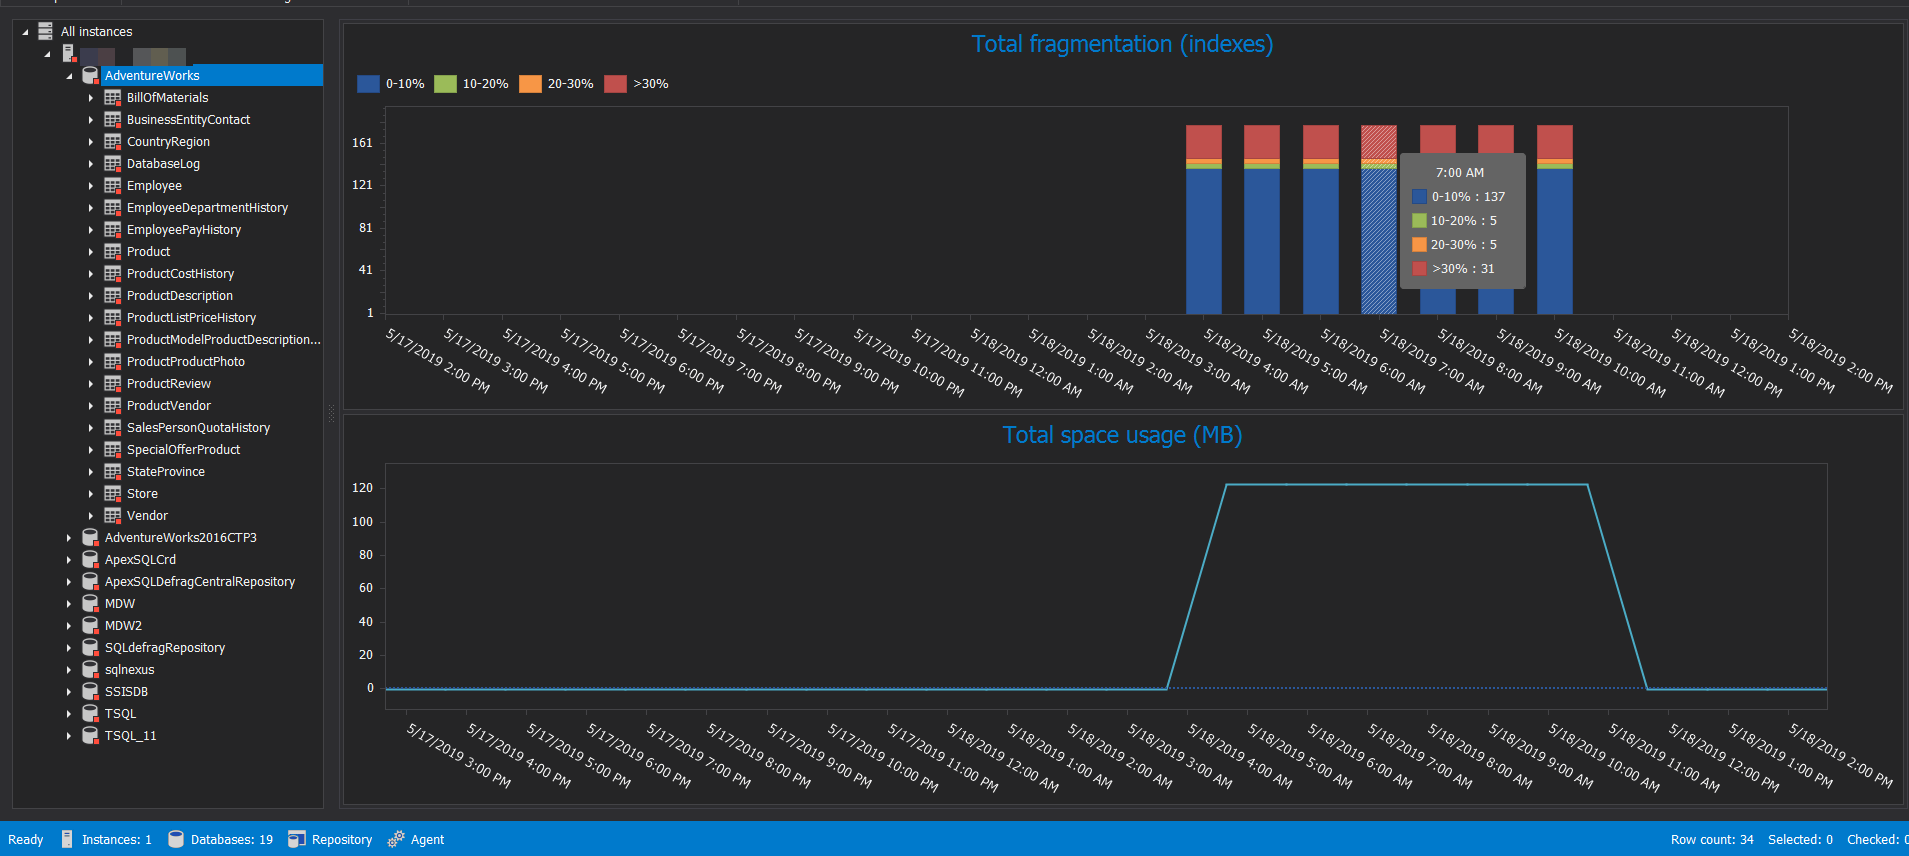
If you click on any database from the Server Explorer window, the report will automatically change the view to show the graph at the database level, as shown below:
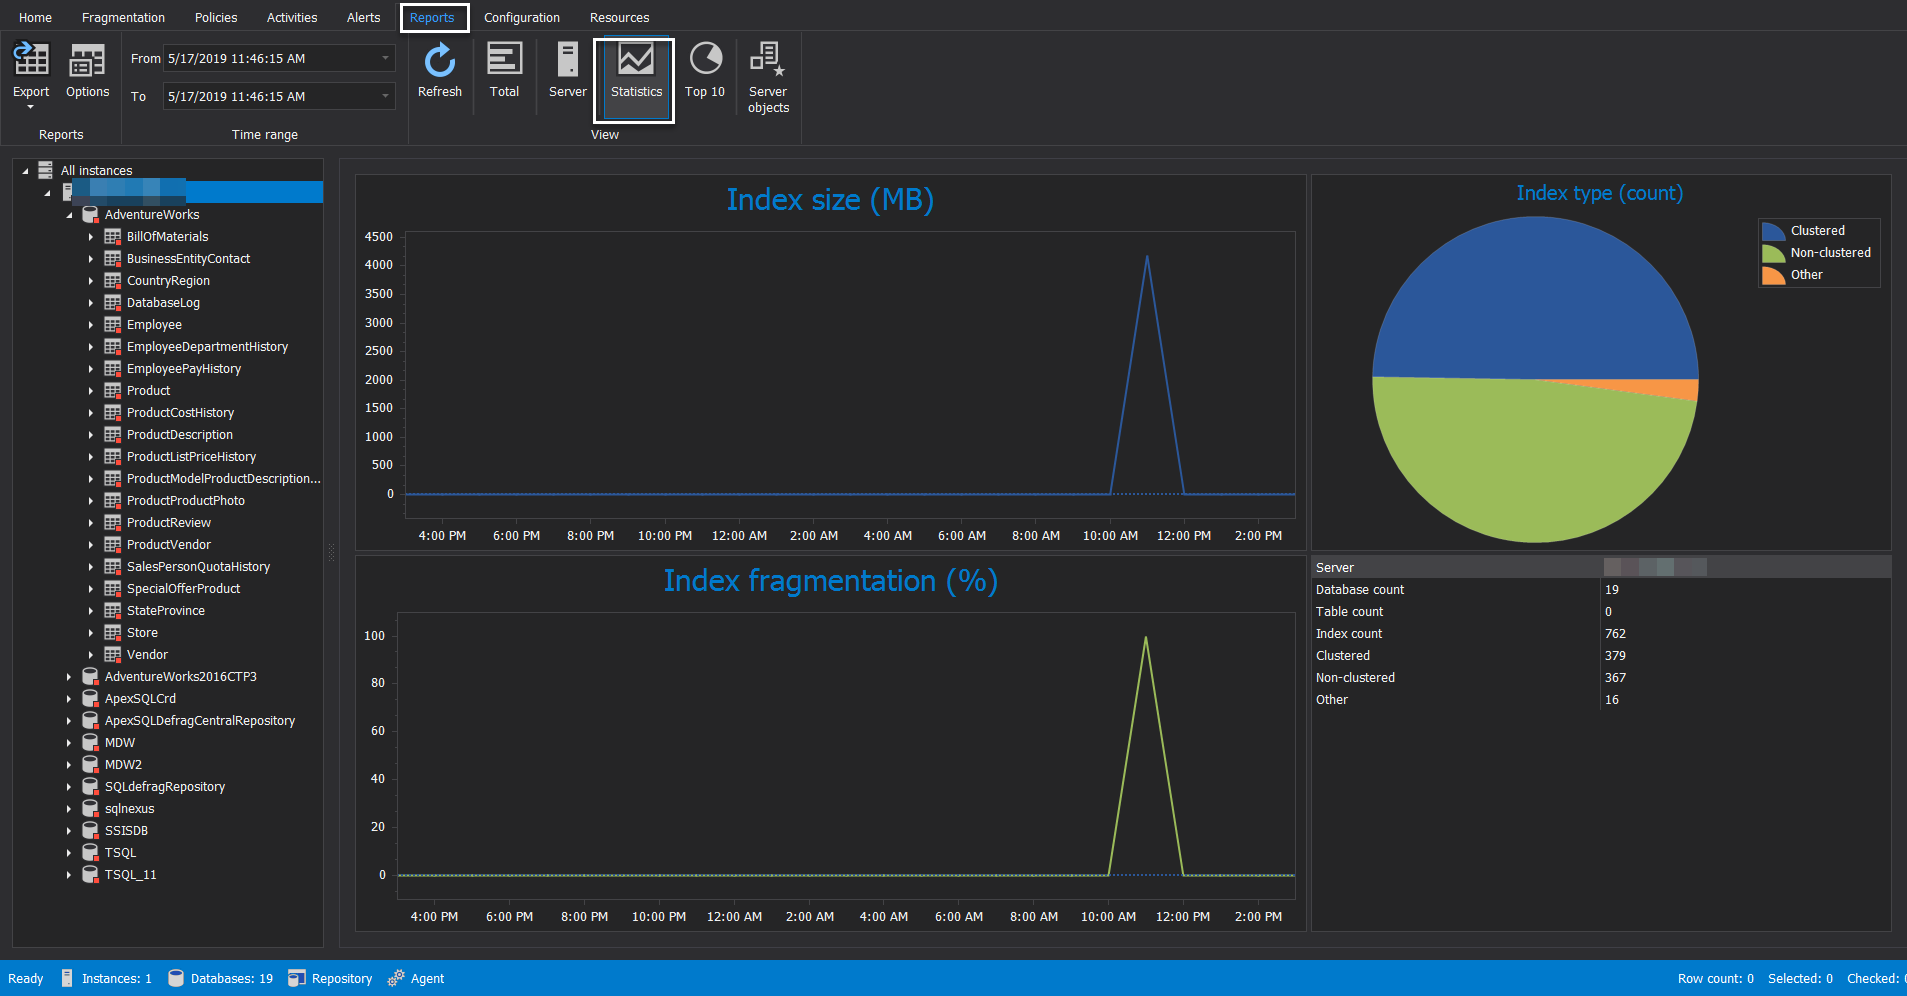
The second report, that can be also viewed at different levels, is the Statistics report. This report shows statistical information about the total indexes size and fragmentation and the distribution of the index types at the selected level, as shown below:
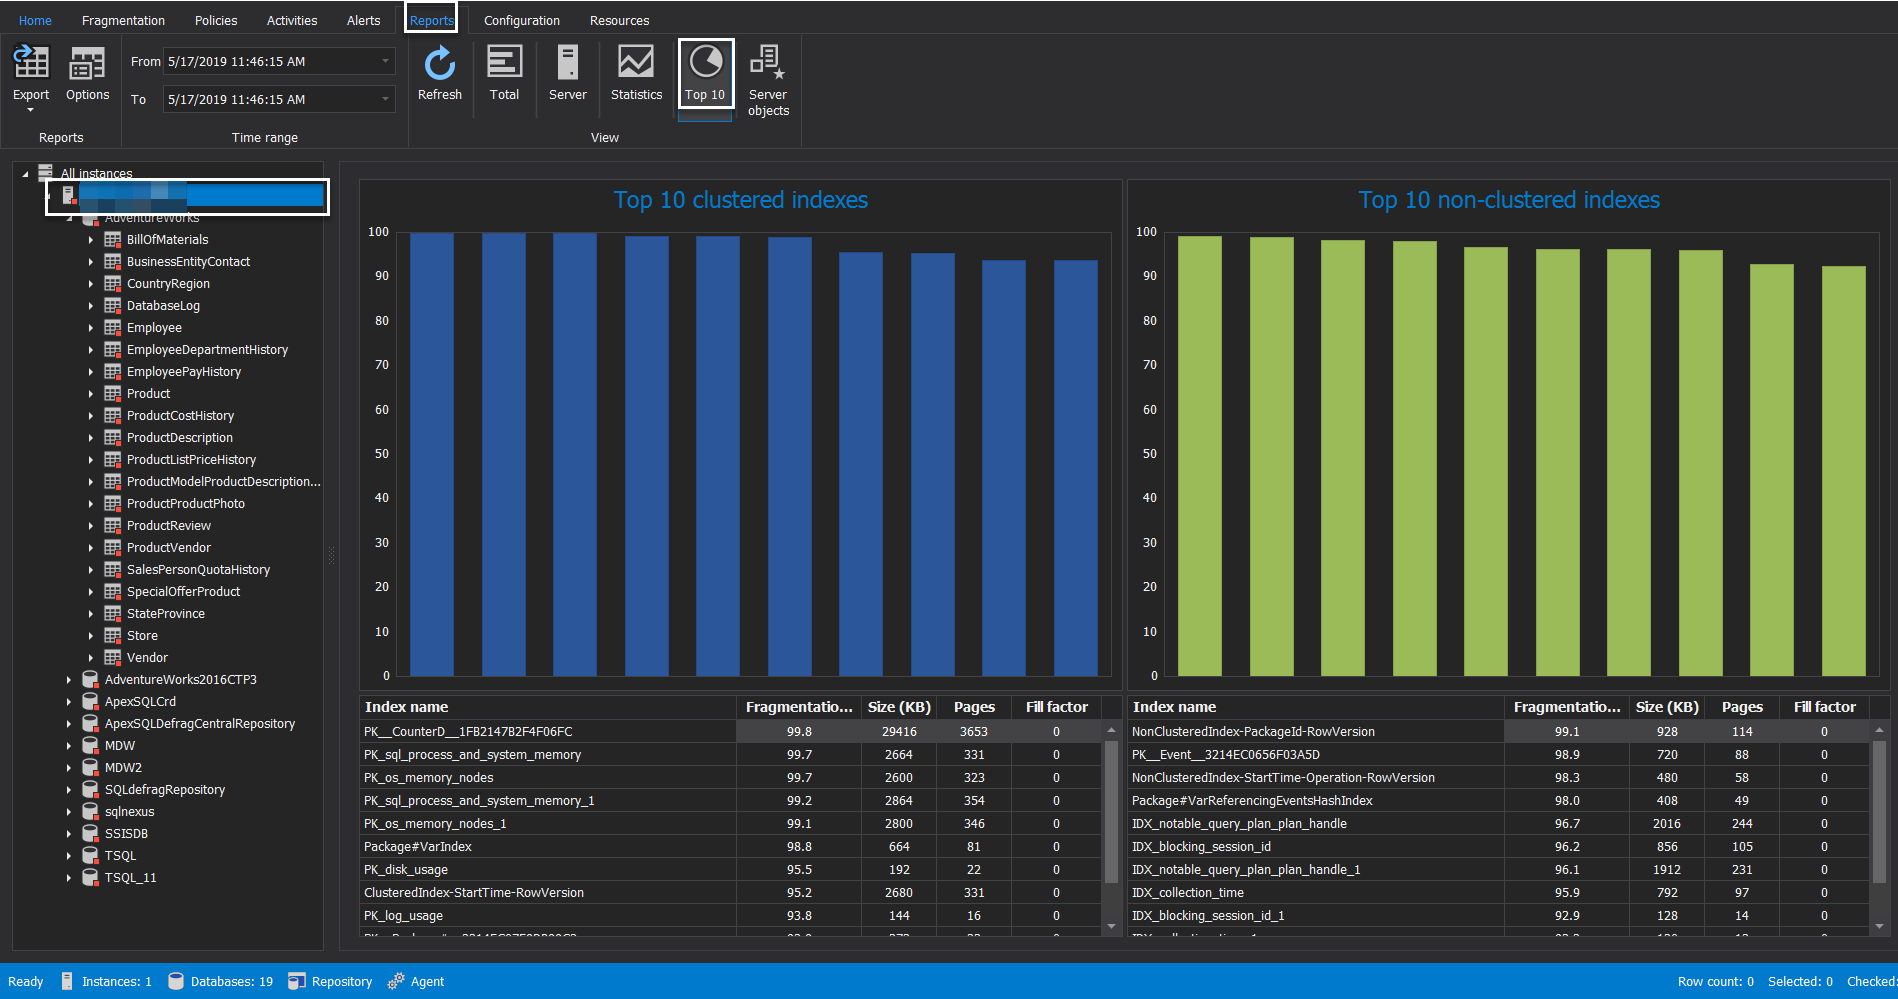
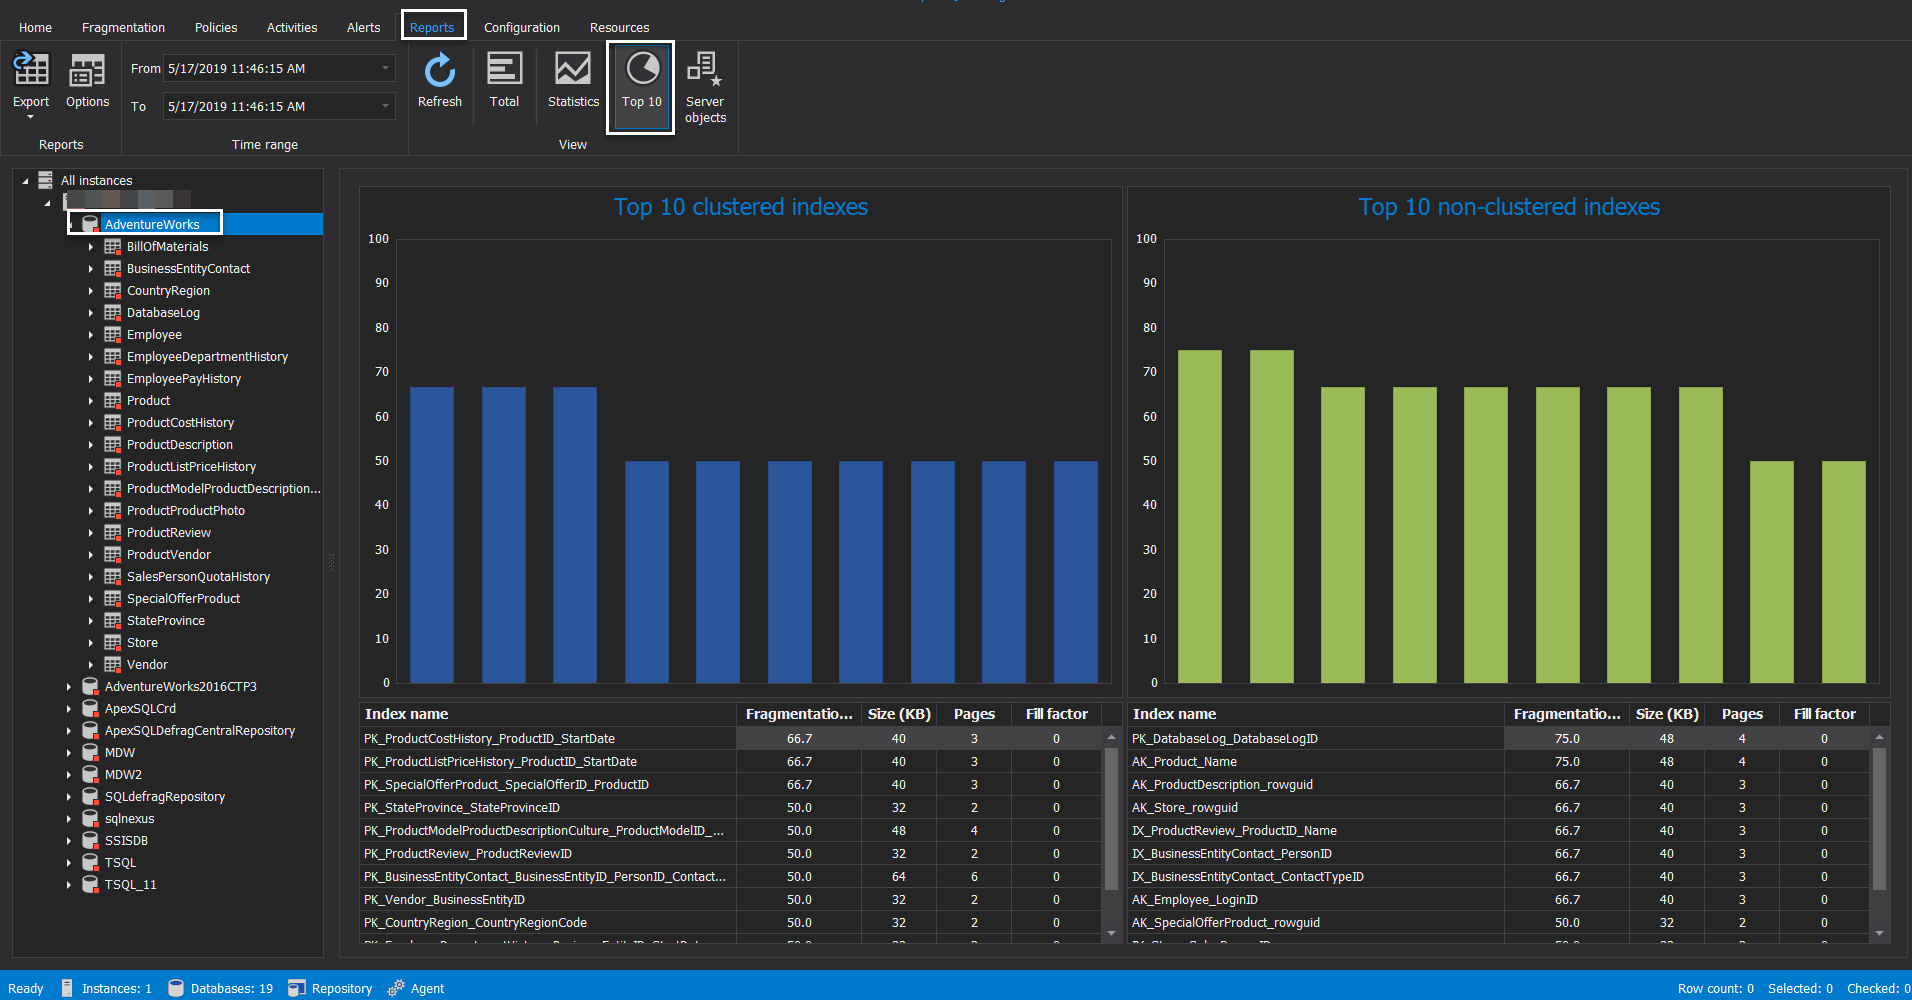
The third report is the Top 10 report, that views the top 10 clustered and non-clustered indexes with the largest size and highest SQL index fragmentation percentage, at the specified level. For example, the following report shows the top 10 expensive indexes, based on the size and fragmentation, at the SQL server instance level:
Moving down to a specific database, the report will automatically show the top10 expensive indexes, based on the size and fragmentation, at the selected database level, as shown below:
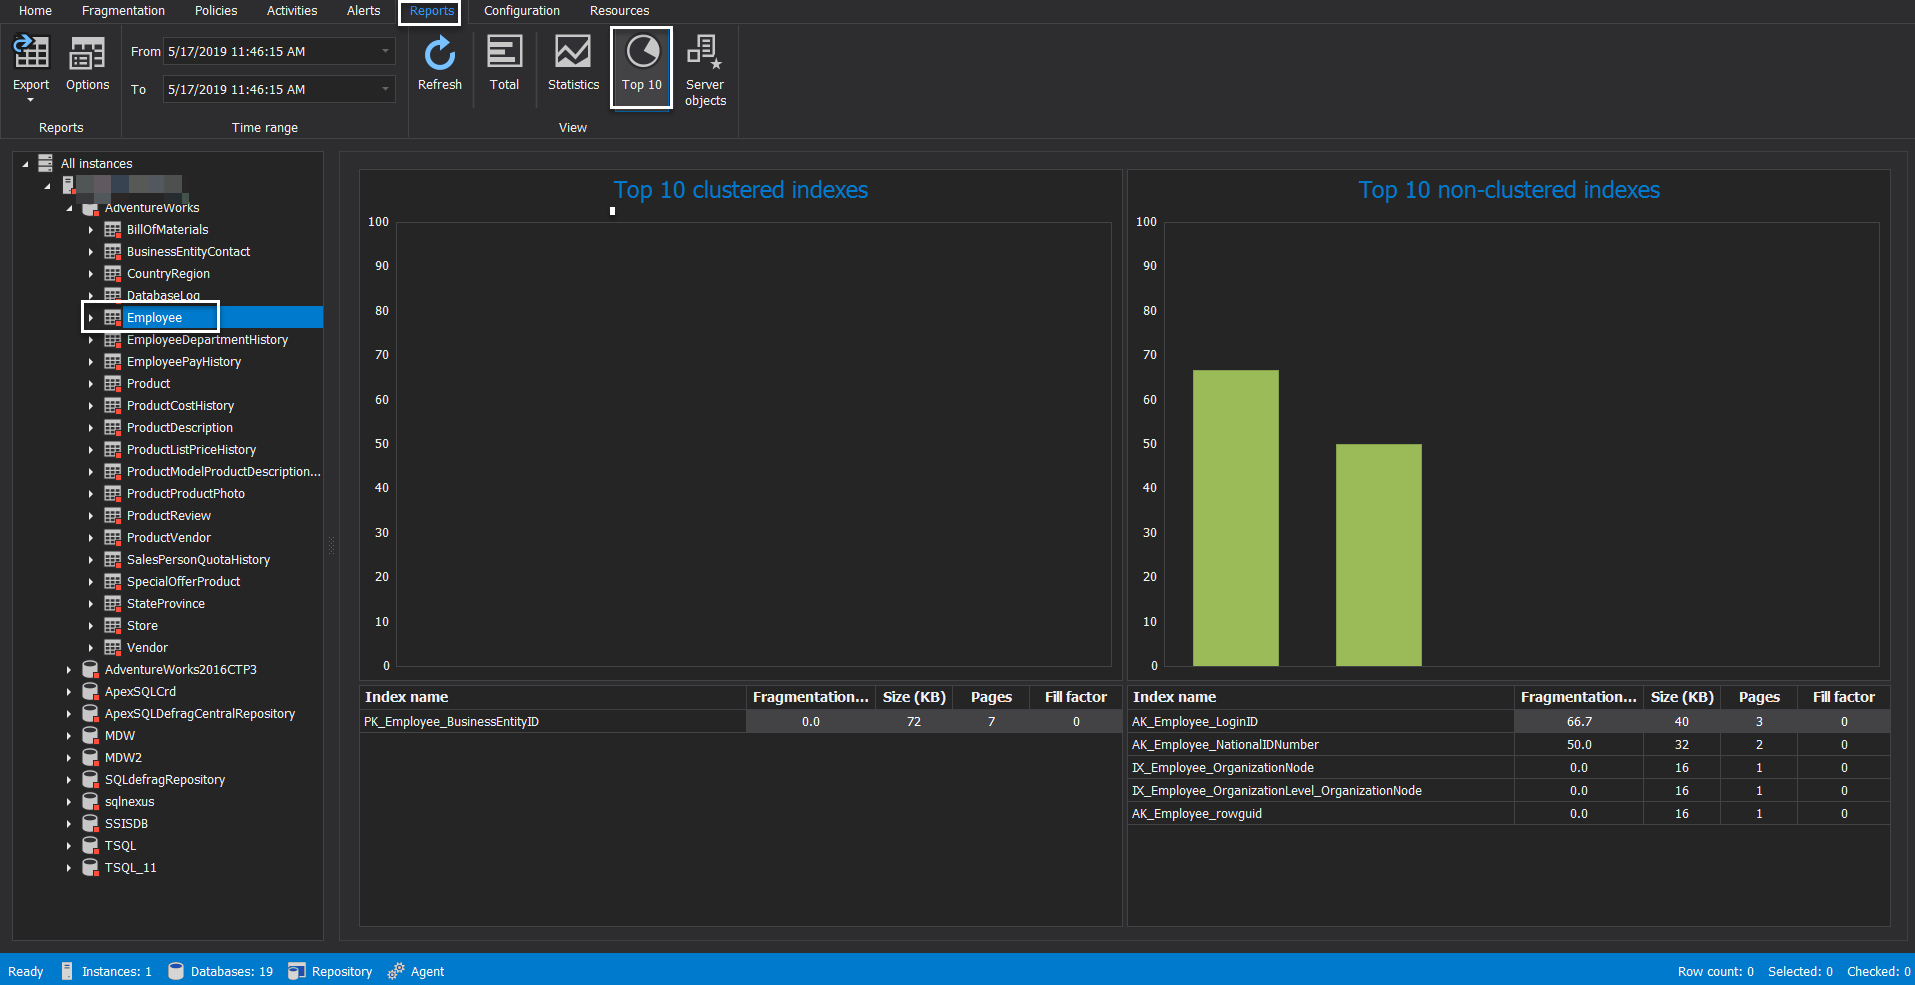
Diving deeply to a specific table under that database, the report will show the top 10 expensive indexes, based on the size and fragmentation, as follows:
ApexSQL Defrag Report Export
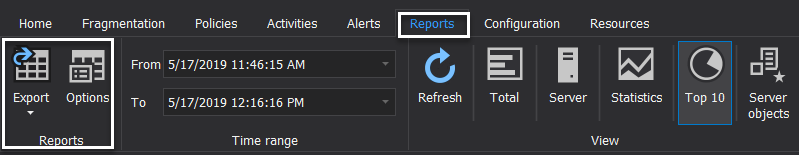
ApexSQL Defrag allows us to export the fragmentation reports to different files formats, includes PDF, IMG, HTML, CS, and XML, with the ability to customize the report setting before it being generated. Under the Reports tab, click on the Options button:
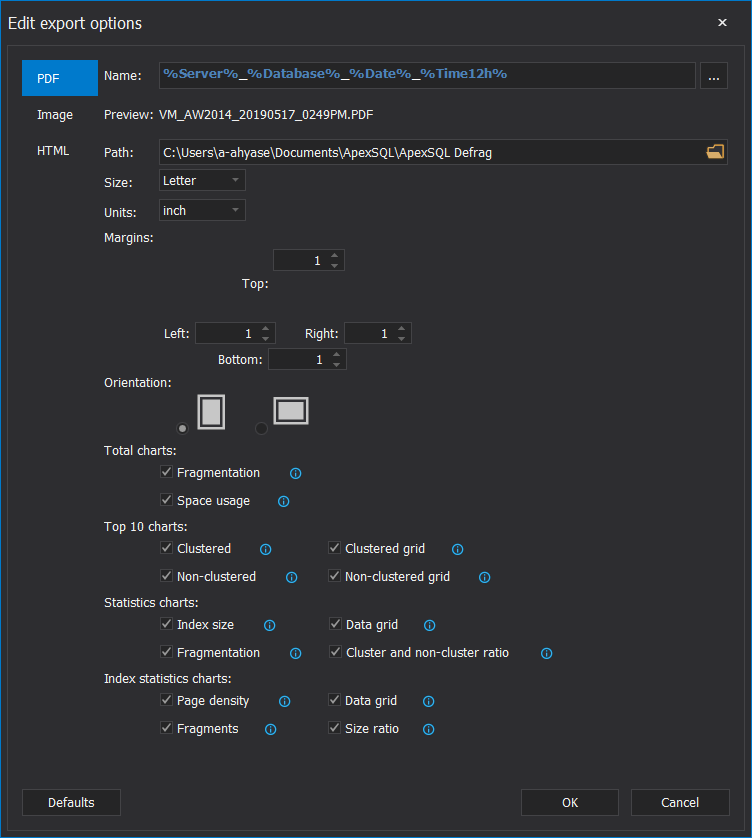
From the Edit Export Options window, you can configure the different options, starting from the naming convention of the generated file, the path where the file will be saved, the page orientation and finally the content of each report, as shown below:
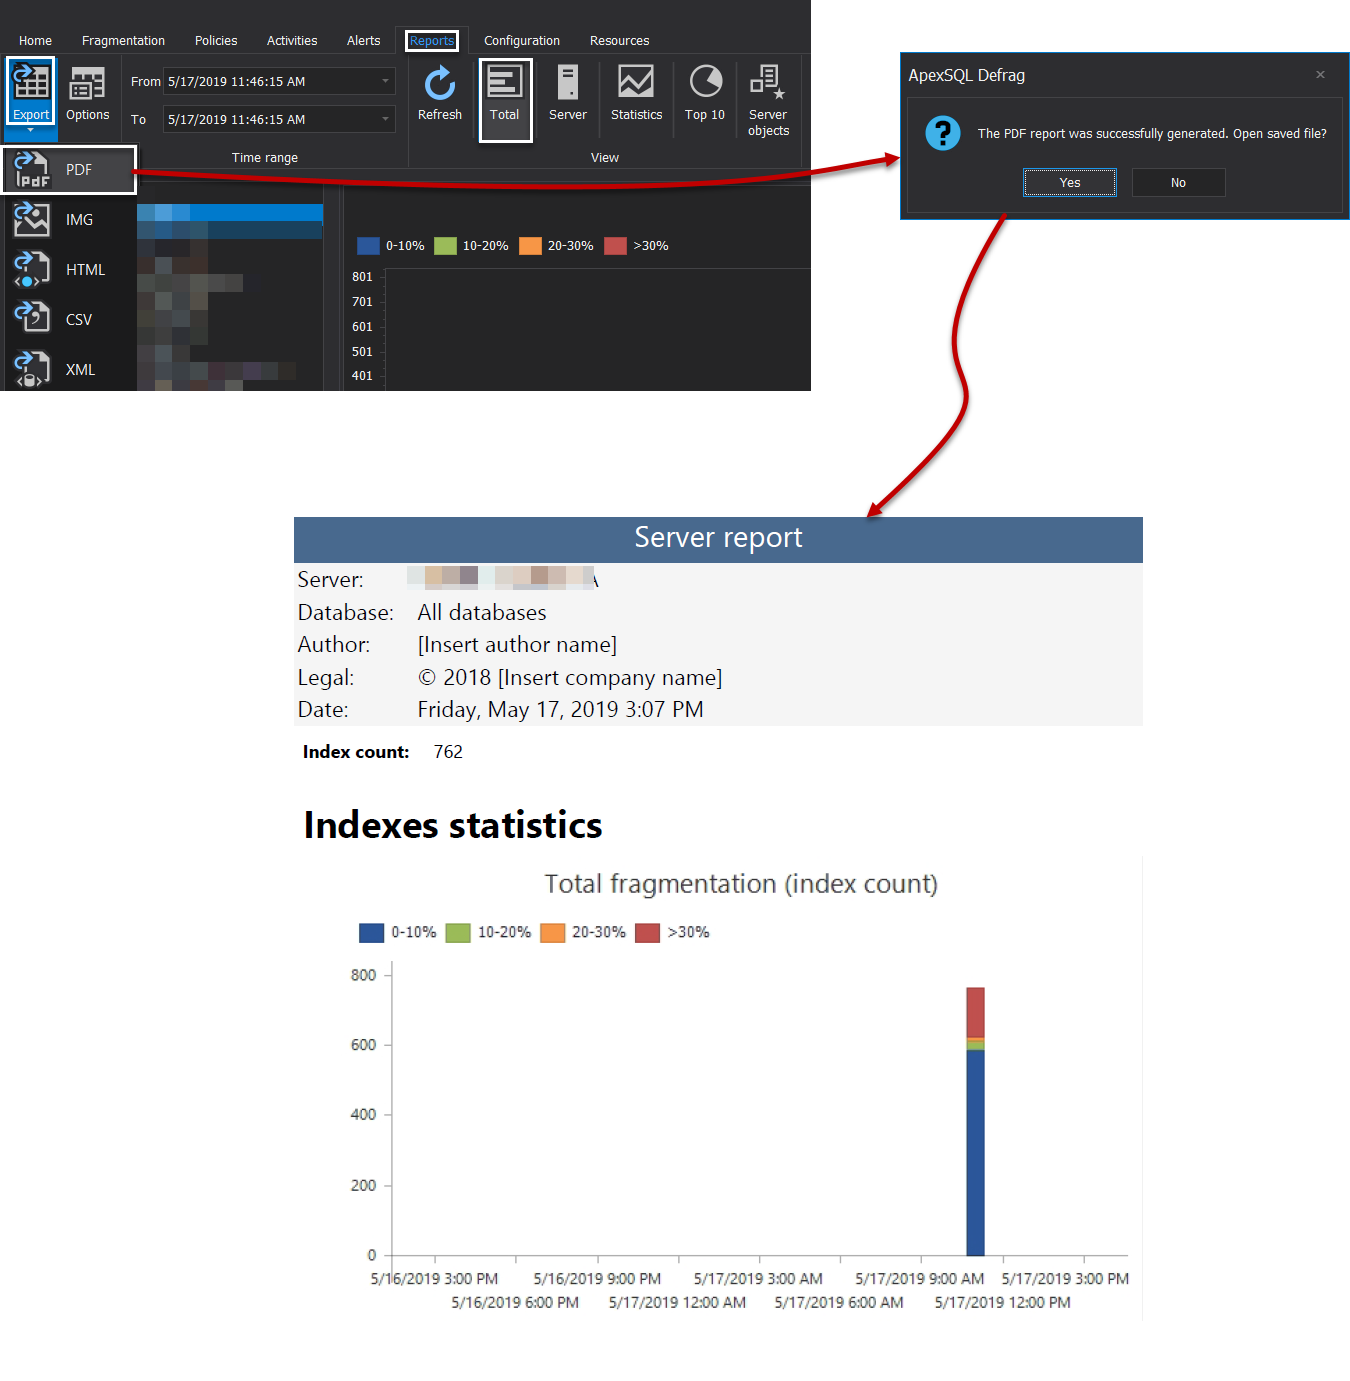
For example, to export the generated Total report at the specified level, click on the Export button, under the Reports tab, and choose the type of file, to which this Total report will be exported. In a few seconds, the report will be generated, asking you whether you want to open the generated report. Click Yes to open that report directly, as shown below:
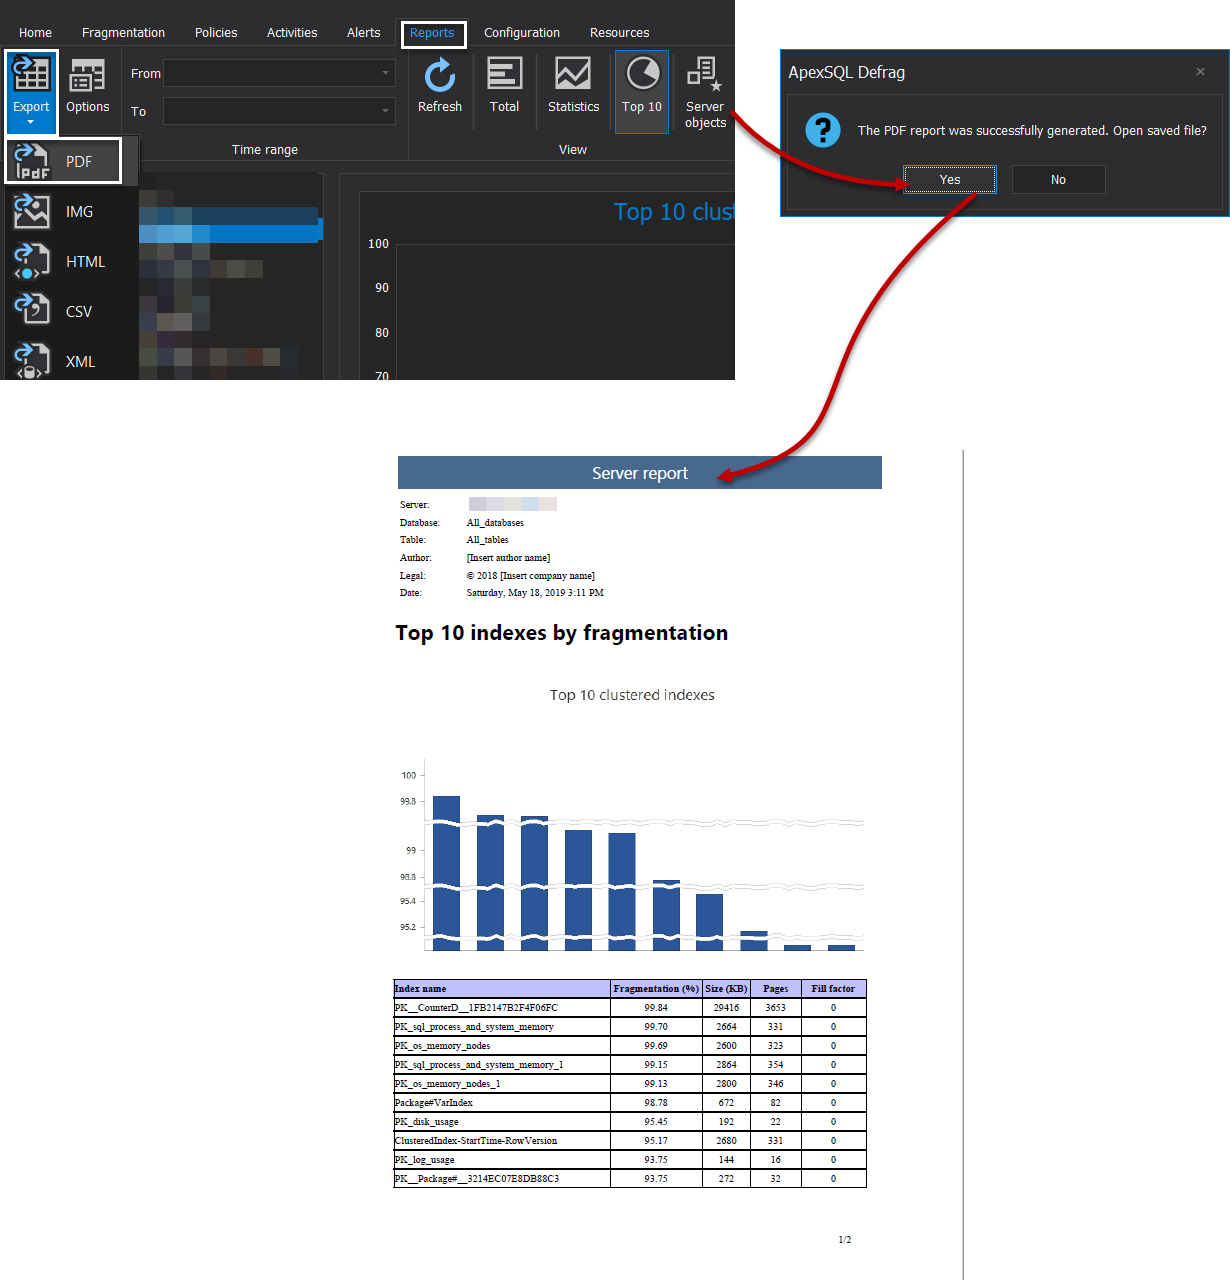
In addition, you can export the Top 10 report at the specified level, by clicking on the Export button, under the Reports tab, and specify the export file type, and the report will be generated quickly, asking you if you want to view the generated report directly. Click Yes to open the generated, as shown below:
It is clear from the previous examples, that we can easily use ApexSQL Defrag tool to review and analyze the SQL index fragmentation percentage information and dive at the different level starting from the SQL Server instance level until the SQL Server index level and display it in different exportable formats, without having the displayed information affected by any server or service restart, as they will be stored in a repository database.
May 20, 2019


