The ability to successfully solve a problem and pinpoint the root cause of an issue that affects SQL Server performance depends on knowledge of the particular SQL Server system and environment, but also on personal experience which can help in determining where to start SQL Server performance troubleshooting.
Basic performance troubleshooting
One of the first things to check during SQL Server performance troubleshooting, are wait statistics. SQL Server Operating System or SQLOS is part of the SQL Server database engine and acts as an application layer between SQL Server components and the Windows OS. The SQLOS enables SQL Server constant tracking and shows why execution threads have to wait. This way SQL Server helps us to drill down to find and understand the root cause of performance problems.
Wait statistics consists of “waits” and “queues”. What SQLOS tracks are “waits” while the queues are the resources that threads are waiting for. There can be numerous waits and each of them indicate different resources for which query waited for. The collected wait stats data for each SQL Server can be obtained from sys.dm_os_wait_stats Dynamic Management View (DMV).
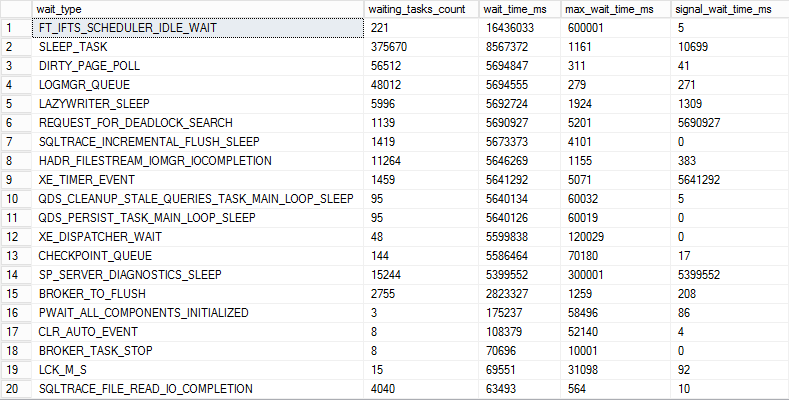
The following query is using sys.dm_os_wait_stats Dynamic Management View and when executed it will list the wait types with the highest total wait time:
SELECT *
FROM sys.dm_os_wait_stats WHERE waiting_tasks_count > 0
ORDER BY wait_time_ms DESC
GO
But there are wait statistic types which are normal and expected as part of SQL Server operations and these wait types generally do not cause performance issues. Therefore, it is important to exclude these from SQL performance troubleshooting and to focus on specific wait types which have the potential to be the main cause of the performance issues including for example CXPACKET, PAGEIOLATCH_XX, and ASYNC_NETWORK_IO
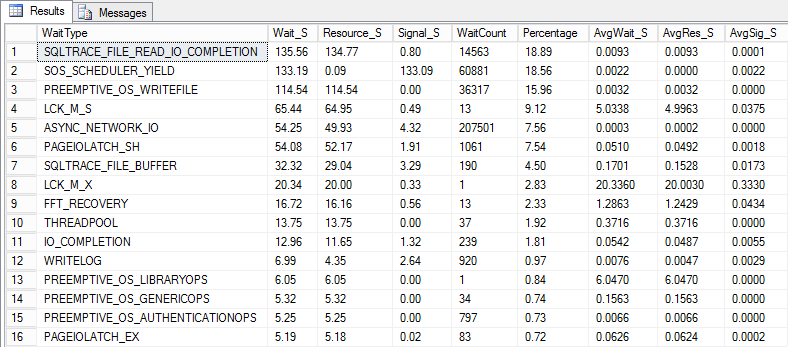
An excellent query for this purpose is from Paul S. Randal blog, which will give the cumulative wait statistic for the most important wait statistic types
This query will list and group together the important wait types as a percentage of all waits and sort them in decreasing order of wait time.
That means that the main focus can be put on the queries at the top of the list. But even with all this information, there is still some work required and additional SQL performance troubleshooting to find out the actual cause of the problem and isolate the specific queries that are causing the performance issues, which will be explained below
Advanced troubleshooting
Using query wait statistics is an excellent approach for SQL Server performance monitoring and allows drilling down to the root cause of performance issues. By analyzing these waits it’s possible to determine where the biggest bottlenecks are occurring. In order to achieve that, a query wait statistic must be collected and stored in a way that allows reviewing and getting precise information about which queries wait on what and for how long. However, collecting and storing query wait information systematically is a challenge, as SQL Server doesn’t provide information about query waits directly. Obtaining such information requires an experienced DBA and can be complex and time consuming. We’ll review some of them below
Traces
One of the methods to obtain this information is the use of Trace files. Trace technology implemented in SQL Server produces very precise information and does capture all the queries, however there are some drawbacks to this technology including:
- The trace file doesn’t contain any historical information
- Tracing must be turned on selectively, which mean that DBA have to anticipate the problem in advance and then to turn on the trace and to wait for results. This makes trace technology unsuitable for 24/7 SQL Server performance monitoring
- Traces can create negative performance impact on SQL Server
- Traces produce way too much information making the analysis and readability of information unavailable for all except for highly experienced DBAs
Dynamic management views (DMV)
SQL Server dynamic management views (DMV) are another alternative. By using the sys.dm_exec_requests dynamic management view (DMV) it is possible to get details about each request that is executing within SQL Server.
In order to get details of currently running queries using sys.dm_exec_requests, the following query can be used:
SELECT
 sprc.loginame as LoginName,
 db_name(sprc.dbid) DatabaseName,
 sprc.spid as SPID,
 sprc.sql_handle as SqlHandle,
CONVERT(smallint, sprc.waittype) WaitType,
 sprc.lastwaittype as WaitTypeName,
 sprc.ecid as Ecid,
 sprc.waittime as WaitTime,
req.statement_start_offset as StmOffsetStart,
 req.statement_end_offset as StmOffsetEnd,
 req.start_time as StartTime
FROM master..sysprocesses AS sprc WITH(NOLOCK) LEFT
 OUTER JOIN sys.dm_exec_requests req ON req.session_id = sprc.spid
WHERE
( sprc.dbid <> 0 AND
  sprc.spid >= 51 AND
  sprc.spid <> @@SPID AND
  sprc.cmd  <>'AWAITING COMMAND' AND
  sprc.cmd NOT LIKE '%BACKUP%' AND
  sprc.cmd NOT LIKE '%RESTORE%' AND
  sprc.hostprocess > ''
  )
When executed, the query will return details about queries currently running
In order this information to be useful, every wait event time for each query has to be measured and queries that have the most impact on the end user must be isolated
To create a query waits statistic tracking system that works, the following is required:
- All specific wait events that causes delays must be identified
- The specific queries that are causing bottlenecks or delayed must be identified, as without that, awareness that SQL Server has performance issue is just not enough. Therefore, SQL Server performance monitoring statistics at an individual query level are the most important for understanding the root cause of the bottlenecks and delays
-
Each wait event time between the query request and the query response must be measured. Without having this information it will be impossible to understand what is causing the bottleneck
- Retaining query wait statistics for given time period to allow tracking performance and historical trends of queries over time. This should ensure DBAs an ability to identify the false positive queries with the same trends over the time or to drill down to any point of interest
In order to get complete information about query wait statistics using sys.dm_exec_requests, the query has to be put in a loop. It must be scheduled and executed in regular intervals and results collected in a table. This will ensure that information about the query wait statistic is available for analysis whenever it is needed. The time interval is usually 1 second, as query that is executed within one second can hardly be a bottleneck. But if more precise details are needed about individual query waits, the execution interval can be set even shorter. It is very important to find a balance between the impact that higher execution frequency imposes on SQL Server, during the test, and actual benefits of more detailed information
The bigger challenge is storing of the query results in a table, though. To create something like this, that is automated, accurate and reliable, can be a challenge. Providing viable information vs just data requires branching decisions on what to log and when, and flow control of information coming from various queries. To meet this challenge, many DBA “roll their own” performance monitor to track, aggregate, analyze and report on this information. Obviously such effort can be expensive and time consuming
Used resources:
Description of the waittype and lastwaittype columns in the master.dbo.sysprocesses table in SQL Server 2000 and SQL Server 2005
sys.dm_exec_requests (Transact-SQL)
sys.dm_os_wait_stats (Transact-SQL)
SQLOS – unleashed
May 20, 2015


