


When it comes to SQL Server performance, you might not think of it as a big deal because of today’s modern hardware but every once in a while, your office phone will start ringing off the hook, your email inbox will start blowing up… SQL Server has been brought to its knees. What happened?
That’s what we are going to look at in this article. The main goal is to identify what some of the common problems are and take a close look at the SSMS Performance Dashboard tool. This tool is available out of the box for DBAs allowing them to diagnose and resolve their SQL Server performance issues quickly and easily for all supported versions of SQL Server from SQL Server 2008 to SQL Server 2017.
SSMS Performance Dashboard used to be a separate download that required a schema to be deployed but with the release of SSMS 17.2, Microsoft released the Performance Dashboard as a part of Standard Reports into SSMS eliminating the previous installation process.
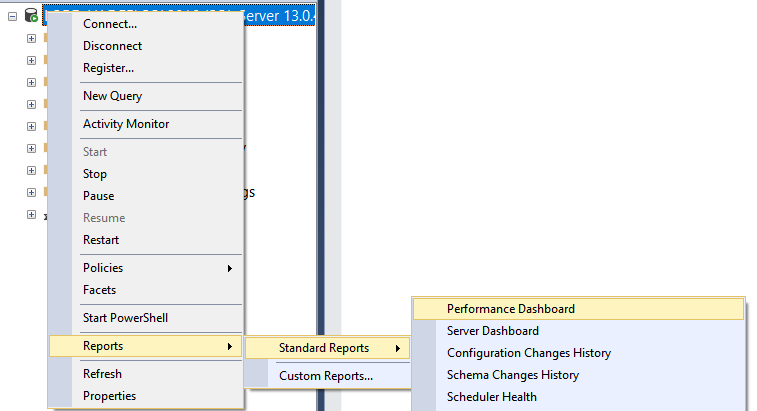
So, let’s select a server in SSMS from Object Explorer, and from the right-click context menu choose Reports > Standard Reports and open the Performance Dashboard:
Next, we will see the data populated in the report:
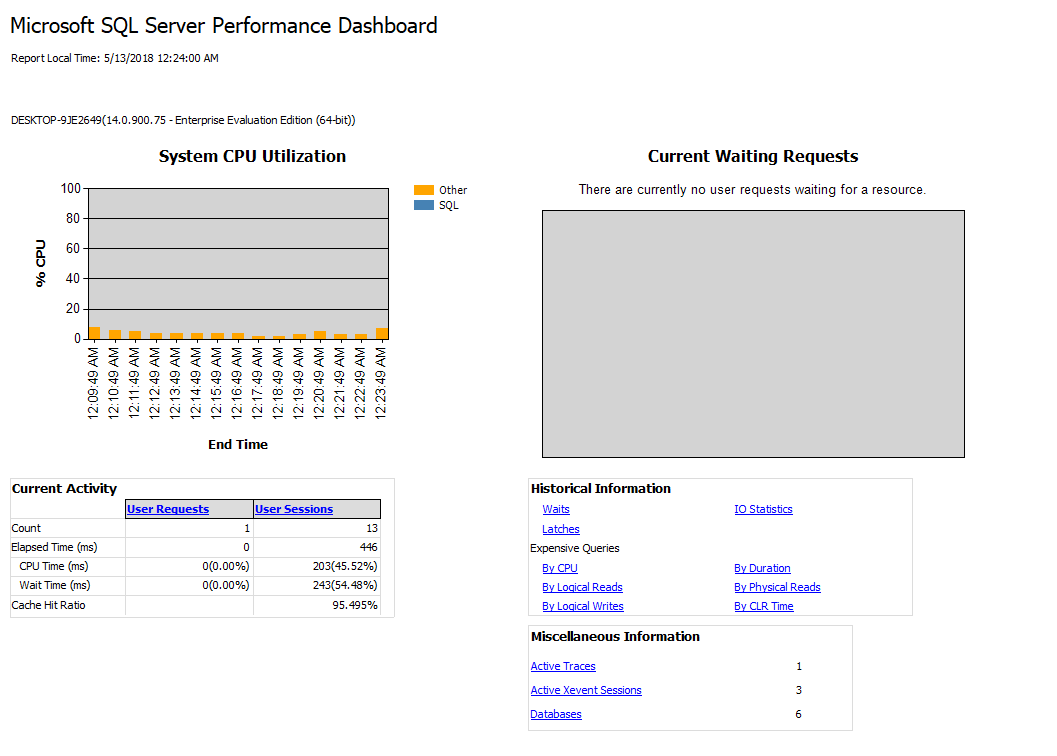
This report is designed to help a DBA easily single out if there is any present performance killers on the targeted SQL Server. From the dashboard itself, we can further click on the hyperlinks to navigate to additional report for further drill through. For example, click the IO Statistics under the Historical Information to show the number of IOs performed for each database since it was brought online:
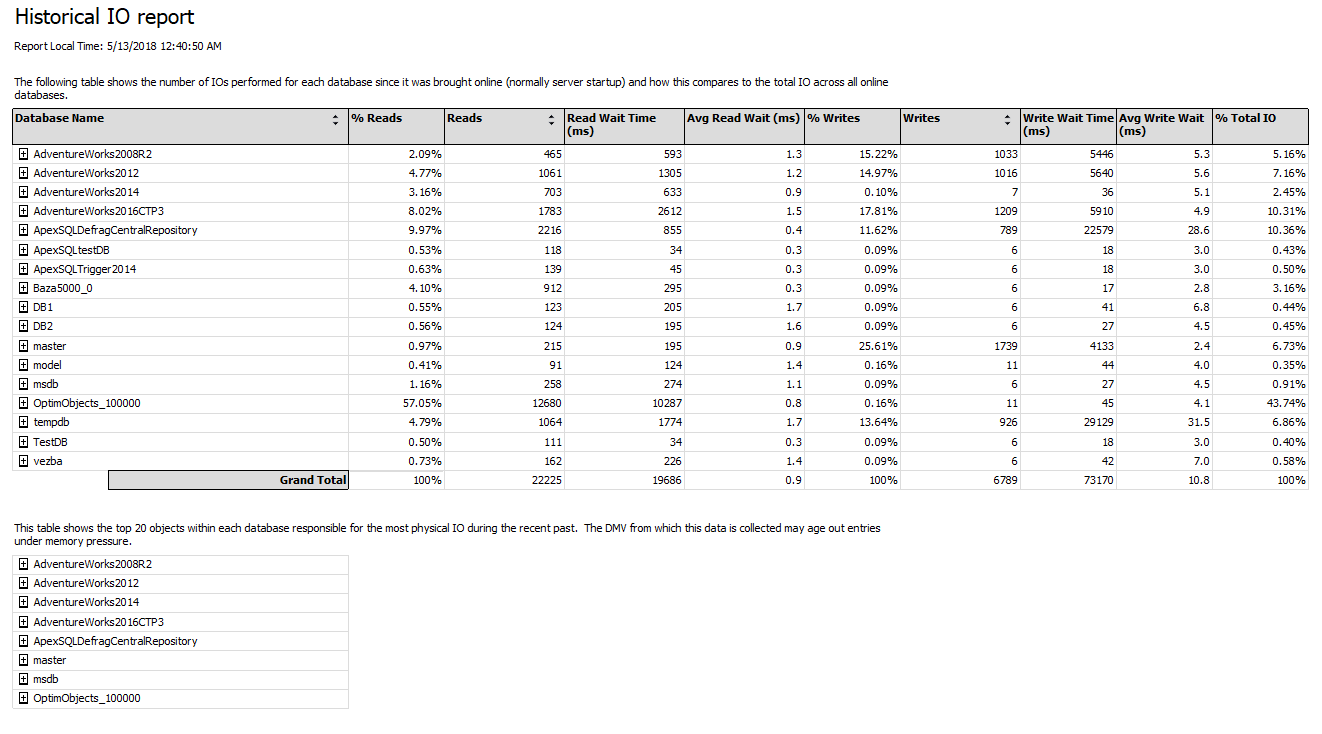
Each hyperlink will generate a report that puts the targeted task into a specific category, so it’s easier to read the generated data and what makes this a great SQL Server monitoring solution.
The most common performance issues which the Performance Dashboard can pick up and help you resolve it cover cases like:
- CPU bottlenecks (shows queries with the most CPU utilization)
- I/O bottlenecks (shows queries with the most disk activity)
- Index recommendations (missing indexes)
- Blocking
- Resource contention (latch contention)
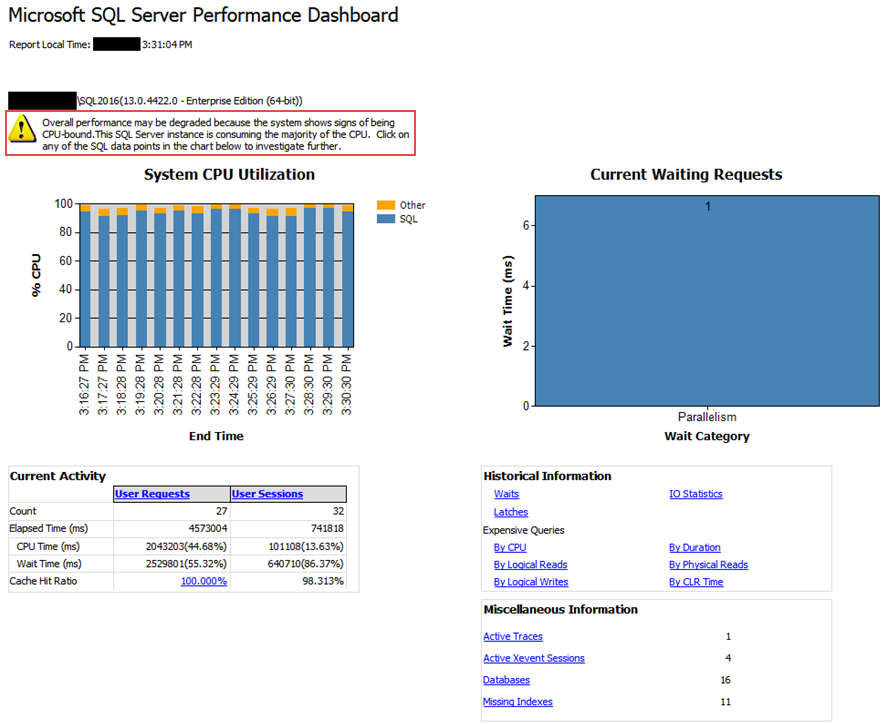
If a CPU holds back the rest of the system, SQL Server Performance Dashboard Report will capture additional diagnostic data that may be necessary to resolve the problem and point out the presence of the issue:
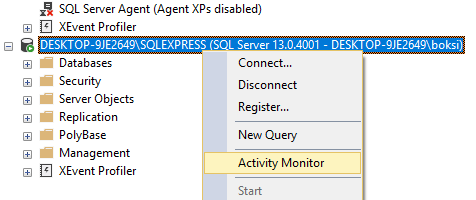
All this information can be used in a global set of SQL Server tools that make an ecosystem. For instance, after reading the reports, we can fire up the Activity Monitor from the same right-click context menu:
This monitor provides an overview of the active expensive queries among other useful information about SQL Server processes and how these processes affect the current instance of SQL Server:
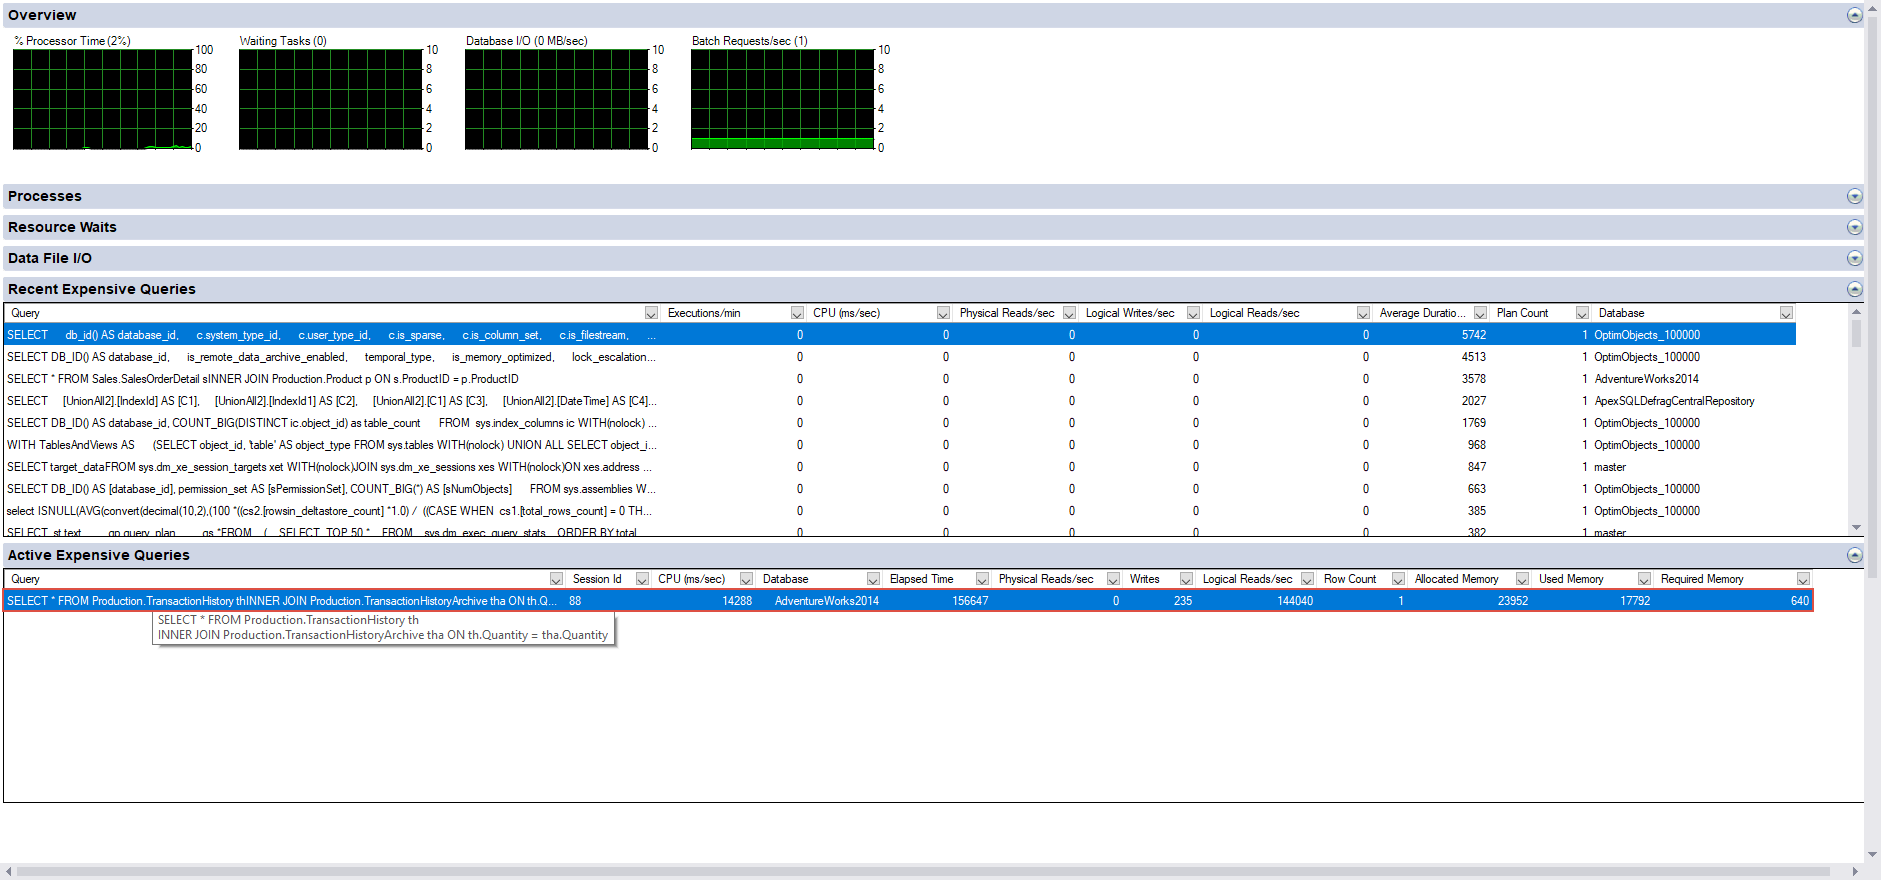
Microsoft indicates that this monitoring has lightweight profiling infrastructure which basically means the service can run all the time and it only takes 1.5 – 2% of resource consumption in terms of CPU. This doesn’t hit overall performance of most SQL Servers and in return brings a lot to the table.
How, what we can do from here is right-click the actively expensive query and choose Show Execution Plan:
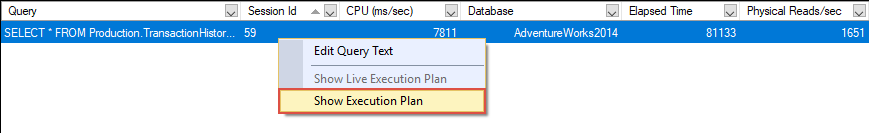
Why? Because recent CPU rate used by this query (see “sys.dm_exec_query_stats.total_worker_time“) is huge, and also the elapsed time of all completed execution of this query (see “sys.dm_exec_query_stats.total_elapsed_time“) is huge which means that this query could be running for hours.
This will open the Execution Plan for this query which we can examine further and look for bottlenecks. In this case, if we pause the mouse over the “Merge Join” operator which is the obvious performance killer with 93% of the total cost relative to the batch, we can view the description and properties of the operator in the displayed tooltip. As shown below, the Estimated number of Rows is extremely high (1,994,870,000) and that’s the cause of the long running query:
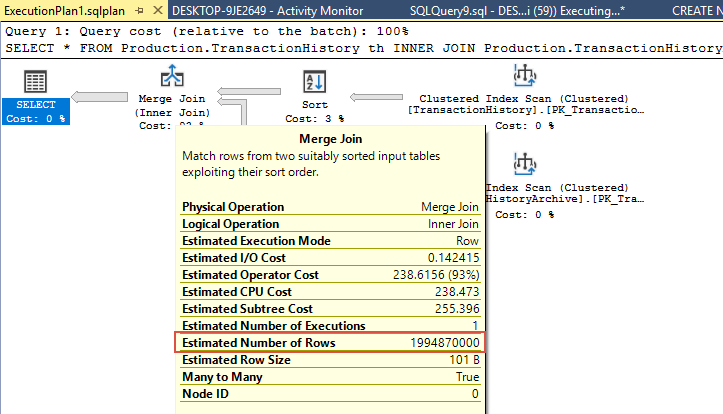
This is a very artificial example, but the point is that we found the smoking gun here. Let’s also take a look at a more real-world example and see what we can do when we come upon a slow/long running query.
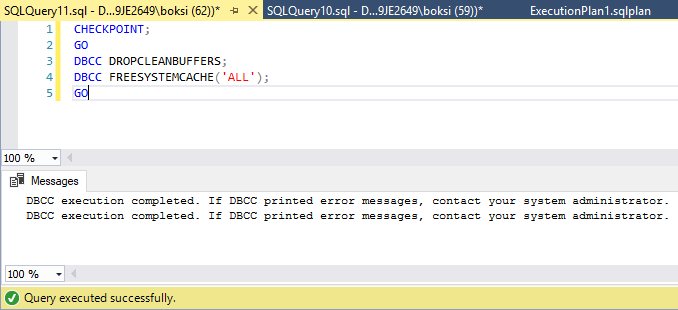
Now, what I like to do before analyzing queries is to create a clear system state which basically means to remove as much as possible from the SQL Server cache. This is easily done by executing the query from below:
CHECKPOINT;
GO
DBCC DROPCLEANBUFFERS;
DBCC FREESYSTEMCACHE('ALL');
GO
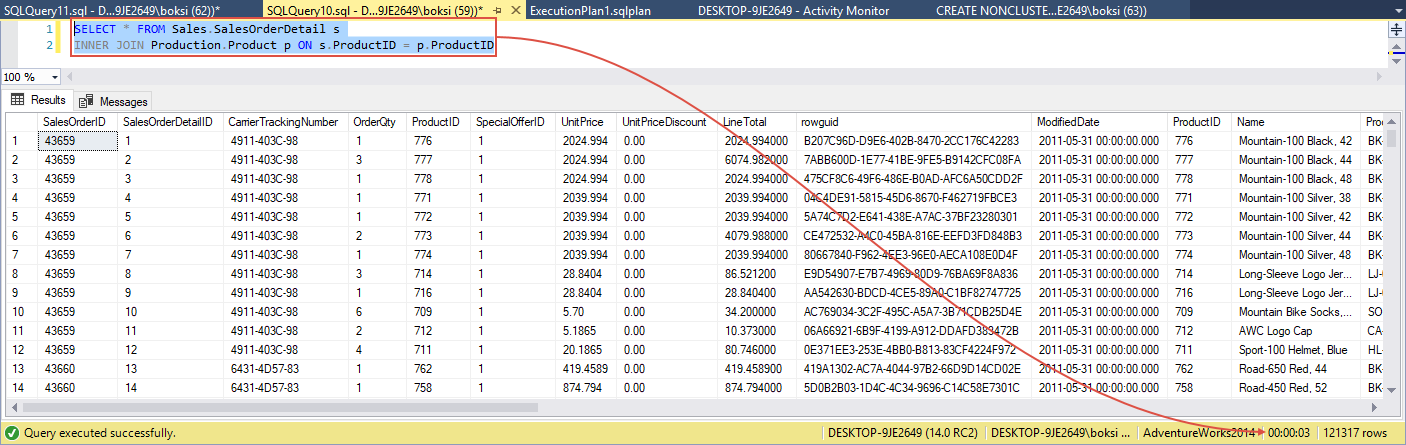
After this step, here’s another query captured as an expensive active query. When executed in SSMS, the status bar indicates that it took 3 seconds to complete:
This is all good, but when it comes to performance you can also consider another tool like ApexSQL Plan that helps me analyze actual/estimated execution plans, and optimize SQL queries better than SSMS’s native execution plans.
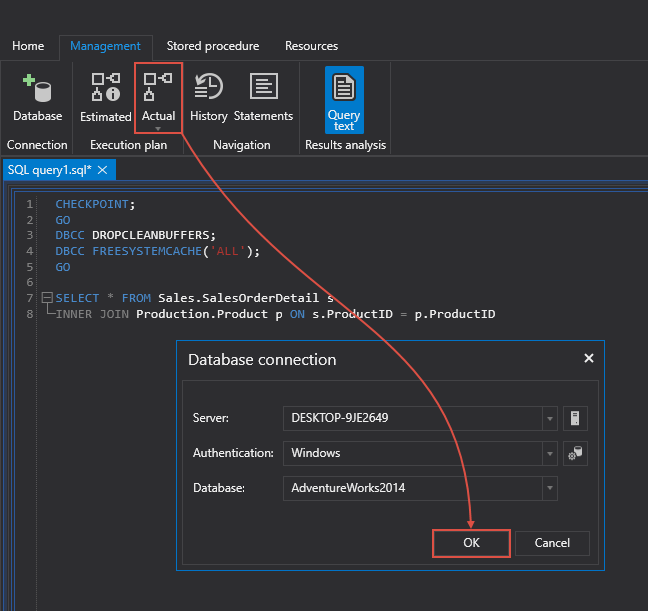
Next, always remember to clear the cache and then execute the query if you want to capture more reliable results. Let’s run the same query in ApexSQL Plan and see the result. Create a new session, paste the code in the editor, along with the “clear cache” part in front, and from the Management tab hit the Actual button. If previously a connection was not established, set the targeted Server, Authentication method, Database and hit the OK to get the actual execution plan:
What we get inside the ApexSQL Plan is operator level performance information of an execution plan. Understanding all of the factors that are needed to ensure that a query is executed as quickly as possible is more of an advanced topic. I do want to highlight the fact that getting in, analyzing and truly optimizing queries does require a fair amount of experience with SQL Server. Also worth mentioning, is that some of the topics fall under the domain of your database developer or administrator. Now, with this little disclaimer being tossed out there it’s okay if you don’t understand the execution plan. But, on the other side, all we need to know right now is under the Select statement under the Duration column:
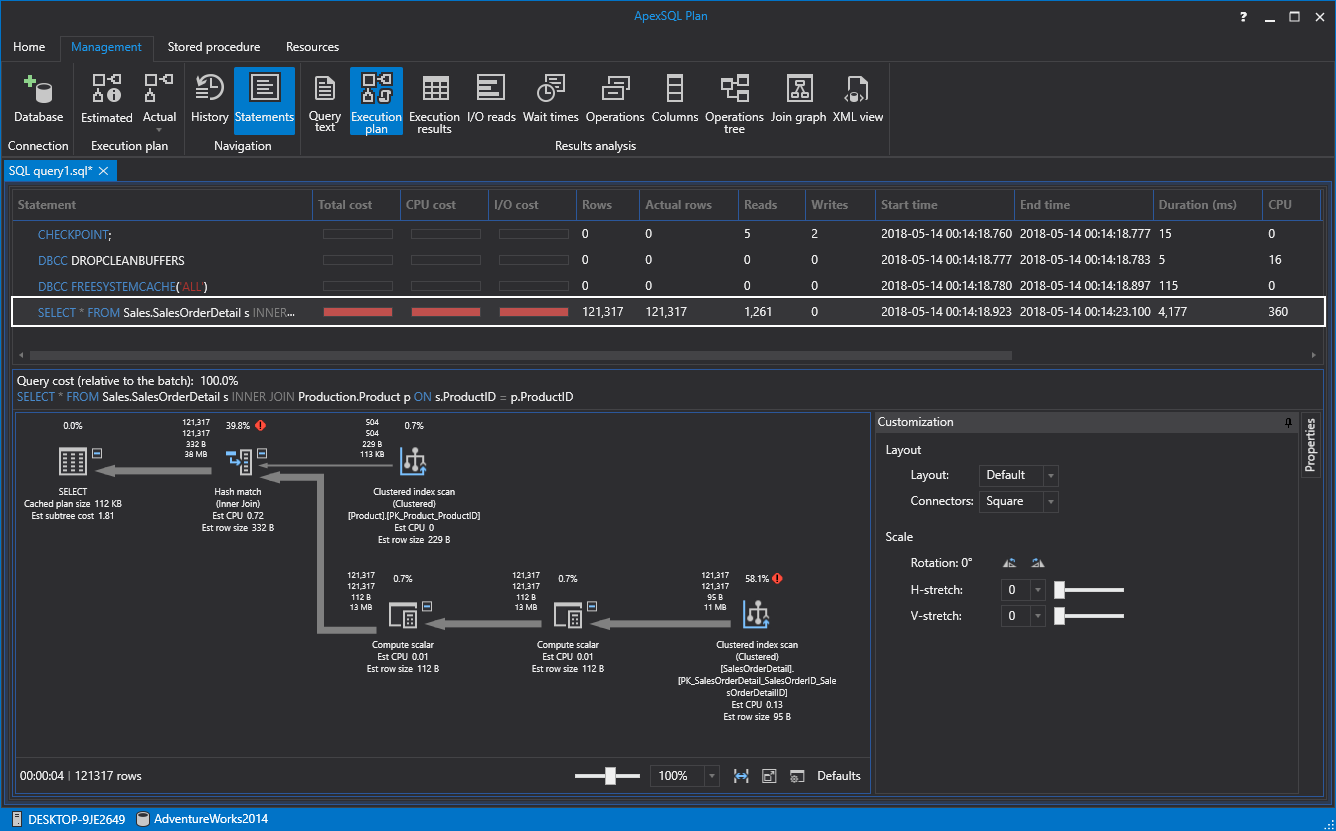
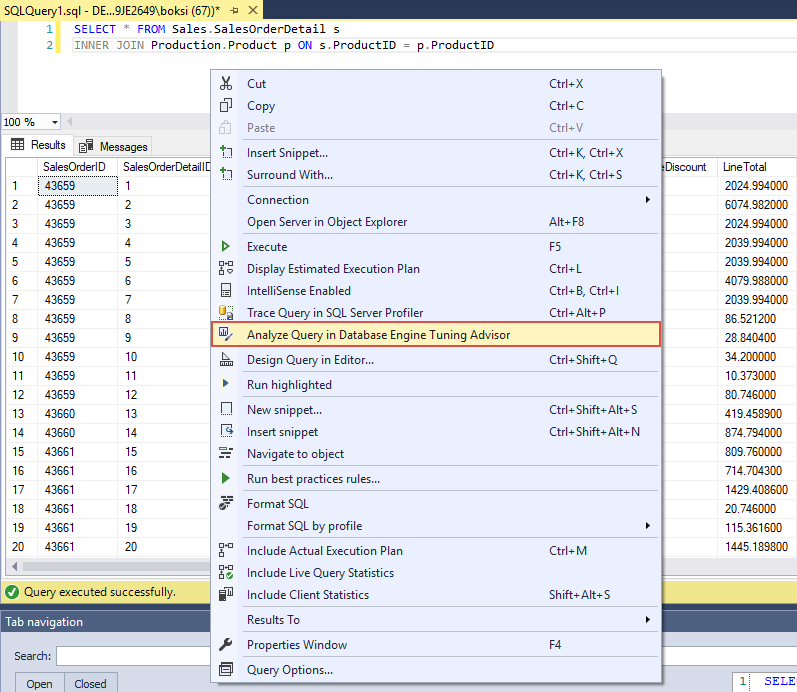
Note that the execution time is in milliseconds and that it’s 4,177 or 4 seconds. If you remember the result from the previous run in SSMS, it was 3 seconds. The reason why it took more for SQL Server to fetch the same data is that this time, the cache was cleared. Next, I’d like to mention another neat optimization tool part of the global ecosystem called Database Engine Tuning Advisor. Go back to SSMS, right-click anywhere inside the query editor and from the context menu choose Analyze Query in Database Engine Tuning Advisor command:
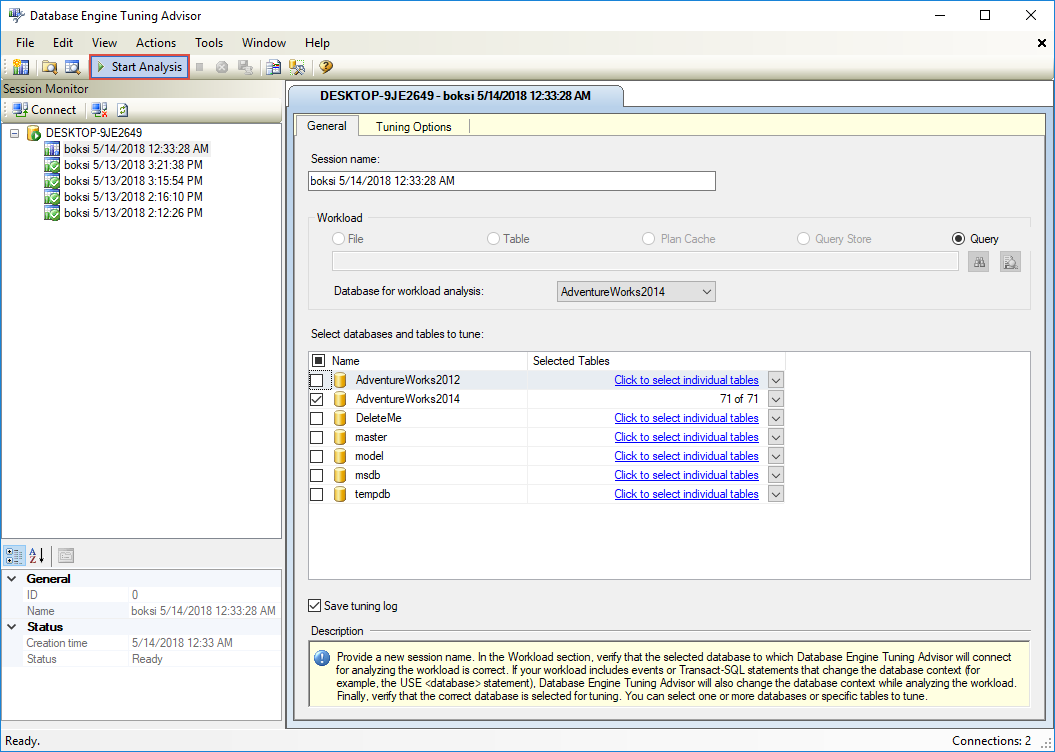
This tool examines how queries are processed in the databases you specify. All we need to do from here, is just to hit the Start analysis button at the top right:
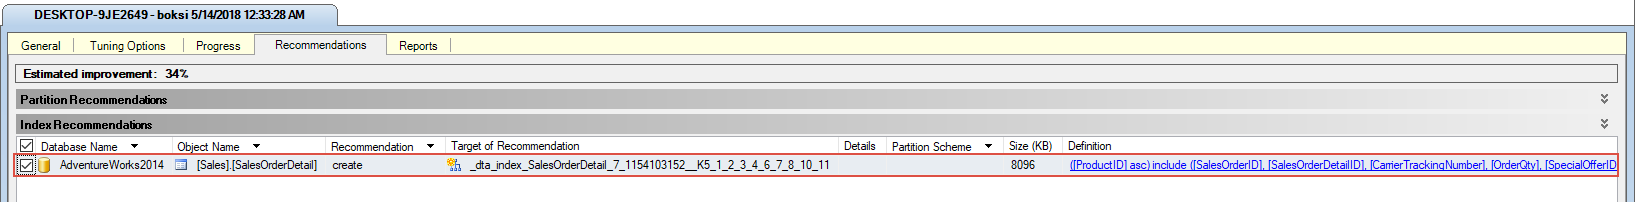
Once the analysis is finished, under the Recommendations tab, you should see suggestions on how you can improve query processing performance by modifying database structures such as indexes, indexed views, and partitioning. In this case, there is only one index recommendation that should improve execution of this query at estimated 34%:
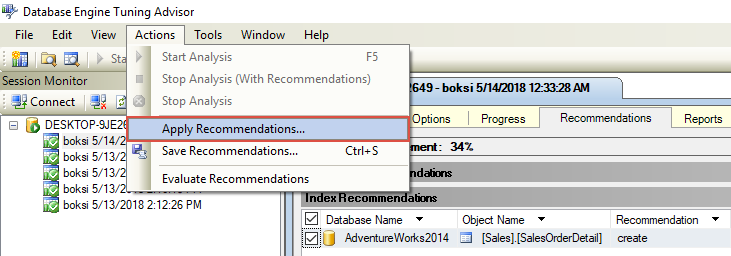
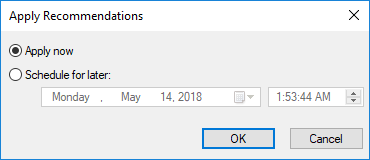
Let’s finish the optimization by going to Action > Apply Recommendations:
Hit the OK to confirm:
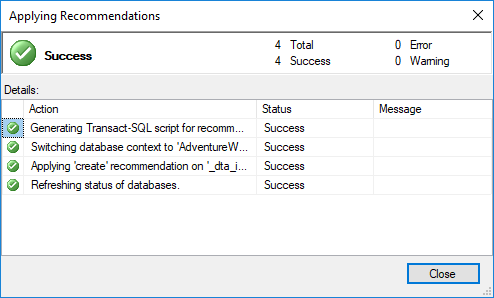
Once done, click Close to finish up the process:
Go back to ApexSQL Plan and execute the same query one more time. This time, the execution took 3,853 milliseconds:
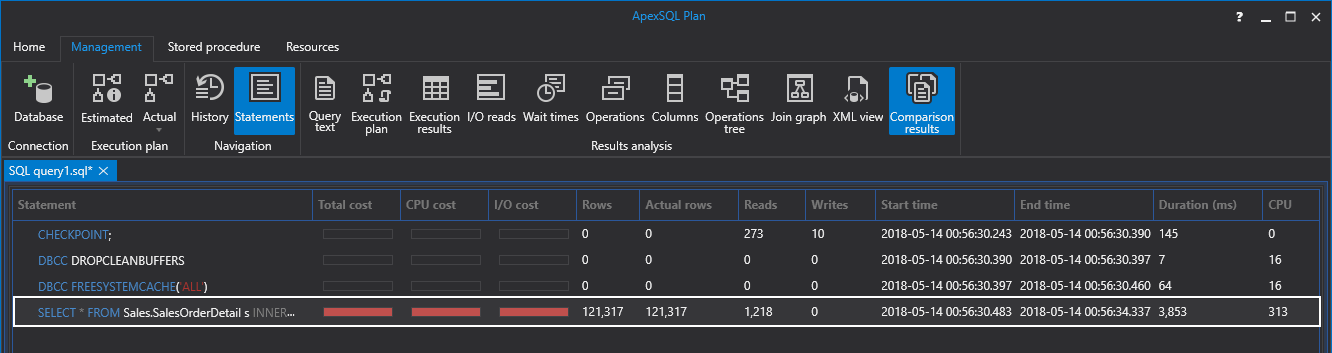
This might not sound like a substantial improvement (4,177 to 3,853) but even a slight 8% improvement like this can go a long way if you think that this query could be coming from an application and the count could go as high as 1000 per hour. And remember, this 8% improvement is done with a single index creation.
I hope this article has been informative for you and I thank you for reading.
References:
New in SSMS: Performance Dashboard built-in
SQL Server Performance Dashboard Reports unleashed for Enterprise Monitoring !!!
Start and Use the Database Engine Tuning Advisor
May 17, 2018


