


Introduction
In a busy system, many things can cause a SQL query to run more slowly than expected or desired. Sometimes, getting a handle on the root cause can involve digging into wait statistics, CPU, memory or network pressure, ferreting out problems in the I/O subsystem, looking for issues in a virtual machine configuration, and many other things. Often though, the problem comes down to a simple symptom: the query is doing too much I/O.
SQL Server can easily produce a lot of information about what is happening. Sometimes finding the critical information is time-consuming at best and thoroughly frustrating at worst. Any tools that can help streamline this process are most welcome. ApexSQL Plan is just one such tool.
In this article, I’ll start off with a simple SQL query to see what ApexSQL Plan can tell us. Then, I’ll enhance it and look at the effect of each enhancement. As we go, you’ll see how to change a few things to make the queries more performant.
Simple beginnings
I’ve used ApexSQL Generate to fill a simple customers table. The table definition looks like this:
CREATE TABLE [dbo].[Customers](
	[CustomerID] int NOT NULL identity,
	[FirstName] [nvarchar](255) NULL,
	[LastName] [nvarchar](255) NOT NULL,
	[Street] [nvarchar](255) NOT NULL,
	[StreetNumber] [nchar](10) NOT NULL,
	[Unit] [nchar](10) NULL,
	[City] [nvarchar](255) NOT NULL,
	[StateProvince] [nvarchar](255) NOT NULL,
	[ISO3_Country] [char](3) NOT NULL,
	[EmailAddress] [varchar](254) NULL,
	[HomePhone] [numeric](15, 0) NULL,
	[MobilePhone] [numeric](15, 0) NULL
) ON [PRIMARY]
I generated 10,000 rows to make things interesting. Now, let’s do some basic queries and let’s use ApexSQL Plan to do them.
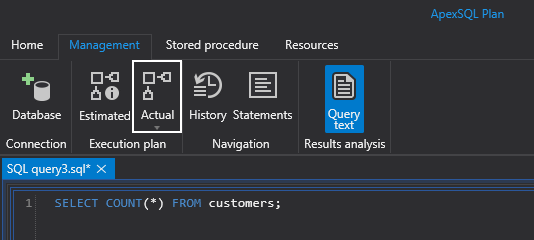
I’ll use the Actual button, shown in the callout above since I want to see the I/O statistics. When I run this query from ApexSQL Plan, I can see the actual plan used and the I/Os done by SQL Server. The execution plan is not much of a surprise:
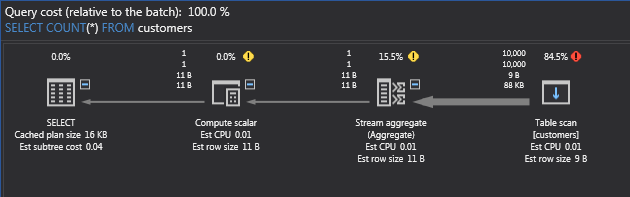
If you’re not used to reading execution plans (whether in ApexSQL Plan, SSMS or other utilities), you start at the right-hand side. There we see that SQL Server has chosen to do a table scan of the customers table. There is really no other choice since this is just a table without any indexes, which makes it a heap. Recall that, in SQL Server, a table is either a clustered index or a heap. The percentages above the operations indicate what proportion of the execution time the query spends there. In this case, the table scan has the lion’s share. No surprise there.
Moving left, the Stream aggregate is there to do the counting of the rows. Then, the Compute scalar operation takes the result of the aggregate and converts it to an integer type. Finally, the SELECT operator returns the count. Above the arrows, you can see the row counts. The top number is the actual row count, the bottom is the estimated row count. Under the row, counts are the expected and actual volumes, with a unit of measure.
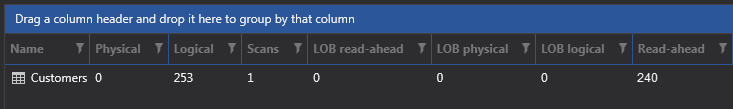
I can now also see the I/O reads used for this query:
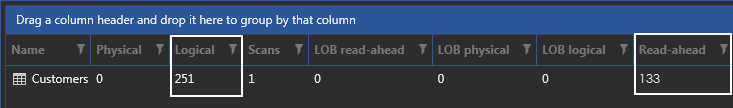
I’ve highlighted two interesting counts: The Logical reads and Read-ahead reads. Logical reads are the number of pages that need to be read to fulfill the request. However, if some or all of the pages are already in SQL Server buffers, the number of physical reads may be less. In my case, all the pages of this table have been cached, so no physical reads were necessary. In a busy system, buffered pages are constantly changing, so the number of physical reads may change with each execution of a query, but the number of logical reads should not change unless the table or the plan changes. Read-ahead reads are done by the database engine when it determines that these can help the query by retrieving required pages before they are asked for. For more detail on how this works follow this link.
Adding a clustered index
Good relational database design dictates that tables should have a key column. This ensures uniqueness. For this customer table, I know that the CustomerID is unique, since it is defined as an identity. I’ll use that for the primary key. I’ll also go ahead and make the table a clustered index, using the CustomerID column as the key. This query will do the trick:
ALTER TABLE dbo.Customers
ADD CONSTRAINT PK_Customers_CustomerID PRIMARY KEY(CustomerID);
Now, I’ll retry my original query to see if the results have changed:
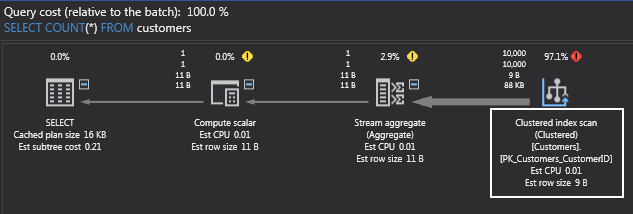
This time, I have a clustered index scan instead of a table scan. What about the I/O reads?
They’ve actually gone up! Surprised? To understand this, recall that a primary key is backed by an index. In SSMS, you can see this:
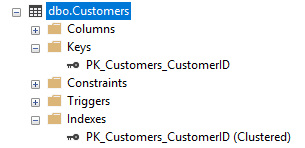
In fact, the table now is a clustered index; it is no longer a heap. That means that SQL Server has built a B-Tree over the data, and inserted extra information in each page as part of the index. As a result, the table now takes slightly more pages (5 more to be precise). However, the database engine is now able to do more read-ahead, making this query feel faster overall.
The real value of an index is not for sequential operations like this one, but for access by key. For example, without the clustered index, if I want to retrieve the last customer in the table:
SELECT * FROM customers
WHERE CustomerID = 1900500;
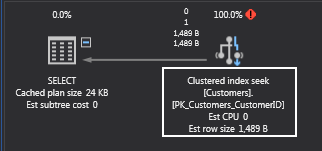
SQL Server will need to read all the pages of the table until it finds this customer:
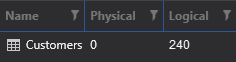
(Logical reads are now 240. I removed the clustered index but otherwise left the table as is.) But with the clustered index in place, things look quite different:

Since the plan uses an index seek instead of a table scan:
Now, you won’t always be searching this table by customer id. What if you wanted to find all customers from states or provinces that begin with the letter “C”? Perhaps a query like this would suffice:
SELECT COUNT(*) FROM Customers
WHERE LEFT(StateProvince, 1) = 'C';
By now, you’re probably anticipating that SQL Server would once again need to scan the table. You’re right! So, what if I put an index on the StateProvince column like this?
CREATE INDEX IX_Customers_StateProvince ON dbo.Customers(StateProvince);
Great! Now, let’s run that query in ApexSQL Plan! And the execution plan is…
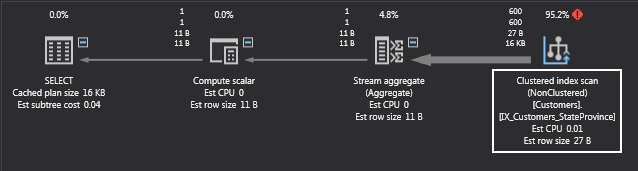
What!? Another clustered index scan? What’s happening here? Look back at the query. The predicate in the WHERE clause uses the LEFT function. Unfortunately, when there is a function like this on the left-hand side, SQL Server is unable to use any index that might be on the columns referenced in the function. In DBA terms, the predicate is not SARGable. SARG is an acronym for Search ARGument. A valid search argument is one that compares a column to a constant value or a variable. See this link for more information on that.
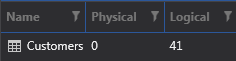
Well, can I transform the WHERE clause into one that is SARGable? I can! Consider this variant:
SELECT COUNT(*) FROM Customers
WHERE StateProvince LIKE 'C%';
You should be able to convince yourself that this query is the same, semantically, as the first one. However, the execution plan is different:
Now, we have an index seek! SQL Server will do a seek to find the first state or province beginning with the letter “C” then read the index in ascending order until there are no more “C’s”. The I/O counts reflect this change:

Just 6 logical reads. Much better! That index really did make a difference. That shows the importance of making your queries SARGable.
Sorting the result set
One last thing I’d like to show you. Suppose that you wanted to see a list of unique last names? You’d probably write something like this:
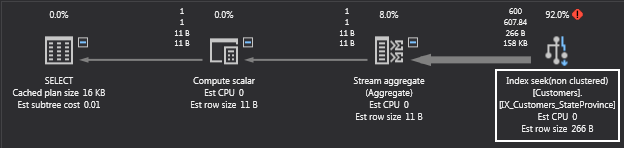
SELECT DISTINCT LastName
FROM Customers
ORDER BY LastName;
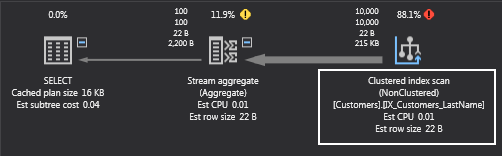
This query also produces a clustered index scan, since there is no index on the LastName column. What I want you to see here, though, is the effect of the ORDER BY clause:
Now, there is a sort operation. That has to cost something, right? Right! The I/O counts are also more interesting:
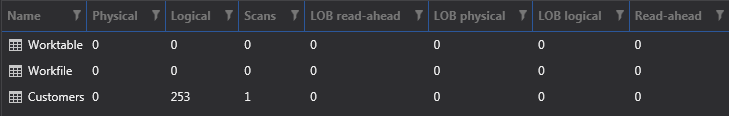
Now, along with the Customers table, there are two other entries. Worktables are internal tables that are used to hold intermediate results. They are generated for certain GROUP BY, ORDER BY, or UNION queries. Workfiles are typically used to store temporary results for hash joins and hash aggregates. Since I have both a hash join and an order by in the query plan, I have both a worktable and a workfile. In my case, no I/O is done against those elements, though they are still allocated since my customers table is small and those intermediate results fit comfortably in RAM. That would not be the case if there were hundreds of thousands or even millions of customers. (Imagine a bank serving most of the population of India or the Republic of China. There could be more than a billion customers!)
Now, if I put an index on the LastName column:
CREATE INDEX IX_Customers_LastName on dbo.Customers(LastName);
The execution plan and I/O counts look different:
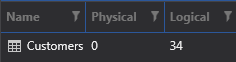
The hash join and sort operations are gone! So are the worktable and workfile tables. SQL Server found all it needed in the index on the LastName column.
Summary
Even a simple query can lead to an inefficient execution plan. Often this is caused by missing indexes but as shown, even with covering indexes, the plan may still be suboptimal, if predicates are not SARGable. Also, be aware of sort operations. Use ORDER BY sparingly.
ApexSQL Plan makes it easy to try out different possibilities and tune your SQL queries to run optimally. The I/O reads reported for query executions deliver key insights as to when you’re on the right track and when you still have work to do.
References
- Reading Pages
- Using Searchable Arguments
- Worktables
August 31, 2017


