


There are various scenarios that can cause problems with your SQL Server. These issues can come as a result of hardware/software performance issues, a physical failure of hardware components, and/or poorly written SQL queries among other things
SQL Server provides a trace of selected events using the trace technology environment. It is accessible through an Application Programmer Interface (API), SQL Server provides SQL Profiler as a GUI for viewing traces in real time, or opening saved trace files. Although the trace technology has nearly no performance impact on the server, viewing traces in real time via the GUI will cause some server performance degradation
“SQL Trace is a lightweight, but powerful, technology that can run on SQL Server; it collects performance data selected from hundreds of possible performance data points ranging from locks, to connections, to SQL DML statements, to recompiles, to you name it” [1]
SQL Server Profiler can configure, start, and stop a SQL trace as well as capture and show SQL Trace data
In order to capture data using SQL Server Profiler, you must create a trace. For each trace you can define the specific data elements you would like to capture. This is achieved through the Trace Properties dialog
The General section of the Trace Properties dialog provides options to determine the method of storing captured trace information
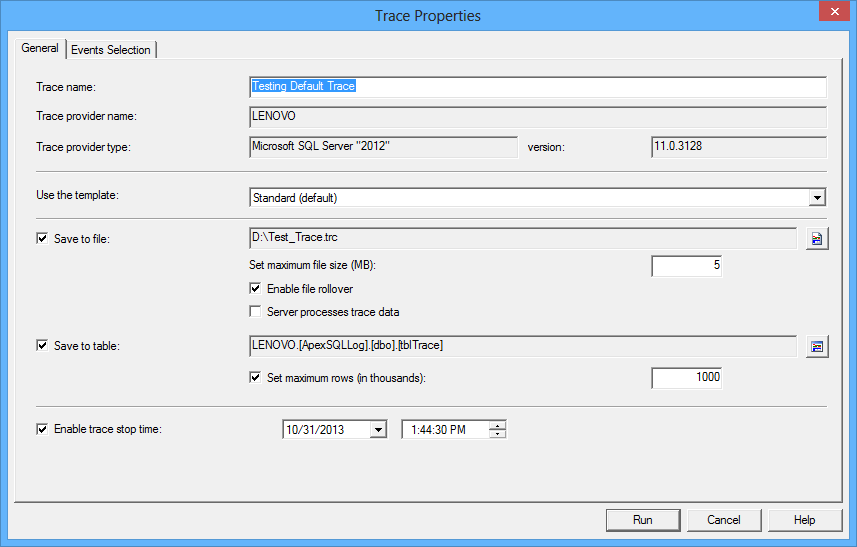
The Events Selection tab allows you to select the exact events and event columns you will capture into your trace. The following picture shows the selection predefined for the Default trace template

If none of the save options (the Save to file or Save to table option) are selected in the General section, trace information will be shown in the trace window
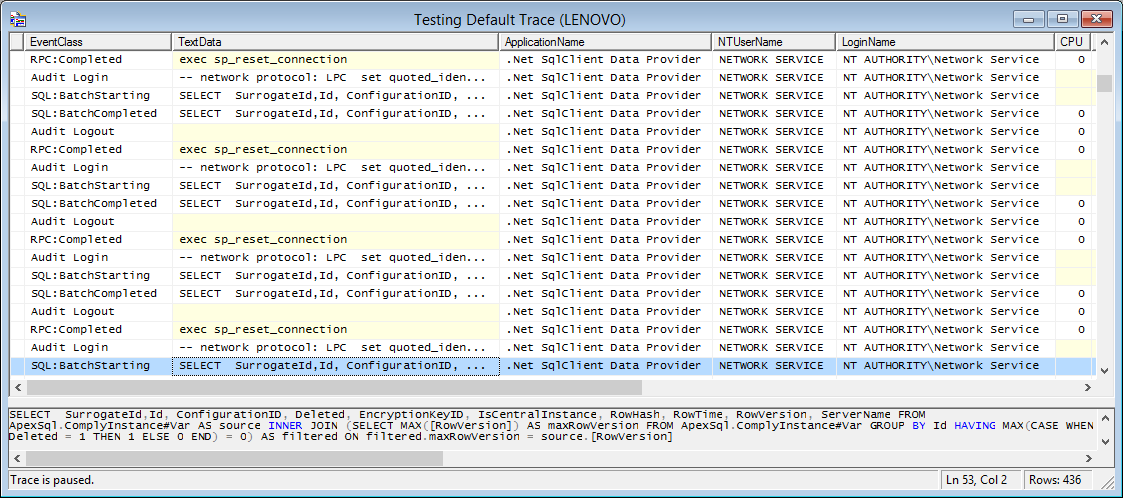
Each line in the trace results window corresponds to a single event selected in the Events Selection tab. The results can be additionally saved as a trace file, SQL table, or XML
To examine the SQL Server trace technology, we’ll take a look at the SQL Server’s default trace next
The default trace
The default SQL Server pre-defined trace consists of five files (each one with a maximum size of 20MB, stored in the SQL Server log folder). These files are used as a temporary storage (buffer) that keeps captured events. The events stored in this buffer get deleted after a while. The oldest file is deleted upon SQL Server restart, or when the currently used file reaches its maximum size. In busy production environments, this circular buffer can be rolled over in a couple of minutes
The SQL Server default trace is enabled by default. To check whether it is enabled or not on your SQL Server instance, execute the following query utilizing the sp_configure system stored procedure and its advanced options
EXEC sp_configure 'show advanced options', 1;
CREATE TABLE #Options (
             name varchar(68), minimum int, maximum int, config_value int,
run_value int);
INSERT INTO #Options
EXECUTE sp_configure;
SELECT
       CASE
       WHEN EXISTS (SELECT
                           *
                      FROM #Options
                    WHERE
                          name LIKE 'default trace enabled'
                      AND run_value = 1) THEN 'Enabled'
           ELSE 'disabled'
       END;
In case the default trace is not enabled, you can enable it with:
EXEC master.dbo.sp_configure 'allow updates', 1;
EXEC master.dbo.sp_configure 'show advanced options', 1;
EXEC master.dbo.sp_configure 'default trace enabled', 1;
RECONFIGURE WITH OVERRIDE;
EXEC master.dbo.sp_configure 'show advanced options', 0;
EXEC master.dbo.sp_configure 'allow updates', 0;
RECONFIGURE WITH OVERRIDE;
The content of the default trace consists of 40 event types (e.g. Audit Database Operation Event, Audit Server Operation Event, Audit Login Change Password Event, etc. – for the complete list of event types see the appendix), and they can be listed by executing:
SELECT DISTINCT
       e.name AS EventName
  FROM
       fn_trace_geteventinfo(1)evi
       JOIN sys.trace_events e
       ON
       evi.eventid
       =
       e.trace_event_id;
The default trace files are standard .trc files (that can be later opened using SQL Server Profiler), and can be viewed with SQL Server Profiler. Afterwards, they can be additionally saved as a SQL table or XML. As these files get recycled quickly, in case the captured events are required for later use or analysis, using Profiler to manually save them is pointless
There are a couple of methods that can be used to preserve the captured events:
- Using the definition of the default trace, create a new trace with the Save to table option enabled, and save the data to a database table
- Querying the default trace files and saving aggregated values
In the next article we’ll describe how the default trace files can be queried to get a list of specific traced security events, and how to generate an aggregate report for captured events
Appendix
The complete list of event types (as named in SQL Server) captured by the default trace [6]:
Database events
- Data file auto shrink
- Data file auto grow
- Database mirroring status change
- Log file auto shrink
- Log file auto grow
Errors and warnings
- Hash warning
- Sort Warning
- Errorlog
- Missing Join Predicate
- Missing Column Statistics
Full text events
- FT Crawl Aborted
- FT Crawl Stopped
- FT Crawl Started
Object events
- Object Altered
- Object Deleted
- Object Created
Security audit events
- Audit Add login to server role event
- Audit Add DB user event
- Audit Add Role event
- Audit Add Member to DB role event
- Audit Change Database owner
- Audit Add login event
- Audit Backup/Restore event
- Audit Database Grant, Deny, Revoke
- Audit DBCC event
- Audit Login Failed
- Audit Login Change Property event
- Audit Login GDR event
- Audit Schema Object Take Ownership
- Audit Schema Object GDR event
- Audit Server Starts and Stops
Downloads
Please download the script(s) associated with this article on our GitHub repository.
Please contact us for any problems or questions with the scripts.
Useful resources:
[1] Microsoft SQL Server 2008 Bible, Wiley Publishing, Inc.
[2] Introducing SQL Trace
[3] Create and Run Traces Using Transact-SQL Stored Procedures
[4] Default trace enabled Server Configuration Option
[5] SQL Trace
[6] List of Events Captured by the Default Trace
This article is part of a series
November 8, 2013


