


In the previous article we introduced and described the SQL Server traces technology, how it works and what it provides in terms of SQL Server auditing. In this article we’ll continue describing the default trace, and how it can be used with T-SQL, without SQL Profiler
The fn_trace_gettable function is a SQL Server system function that returns trace file data in a table format. It provides a method for querying trace data stored in a .trc file, and can be used in a SELECT…INTO statement to load the data from the file into a SQL Server table
As the fn_trace_gettable function requires access to the trace files with the exact path, it’s handy to have a universal SQL script that provides this information. That will ensure each SQL script is to access trace files no matter where SQL Server saves the traces
The following SQL Script returns the full path to the folder where the traces are saved:
SELECT
       REVERSE(SUBSTRING(REVERSE(path), CHARINDEX('\', REVERSE(path)), 256))
  FROM sys.traces WHERE is_default = 1;
In addition, as trace files can be rolled over in a couple of minutes, it is important to execute the fn_trace_gettable function periodically, and to omit duplicate trace entries. To do that it’s necessary to query the function periodically (e.g. each 5 minutes), and to add the following SQL condition that narrows the events to be read from trace entries:
StartTime > DATEADD(mi,-5,GETDATE())
How to query specific SQL Server trace events
Let us examine how several security related event types, captured by SQL Server traces, can be returned using T-SQL. We will query the following events from the default trace:
- Add a DB user event
- Add a login event
- A failed login
SELECT
       XE.name AS EventLabel ,
       x.subclass_name ,
       y.DatabaseName ,
       y.DatabaseID ,
       y.NTDomainName ,
       y.ApplicationName ,
       y.LoginName ,
       y.StartTime ,
       y.TargetUserName ,
       y.TargetLoginName ,
       y.SessionLoginName
  FROM
       sys.fn_trace_gettable((SELECT
	       REVERSE(SUBSTRING(REVERSE(path),
		CHARINDEX('\', REVERSE(path)), 256))
	       + 'log.trc'
       FROM sys.traces WHERE is_default = 1), DEFAULT)y

  JOIN sys.trace_events XE
       ON
       y.EventClass
       =
       XE.trace_event_id
       JOIN sys.trace_subclass_values x
       ON
       x.trace_event_id
       =
       XE.trace_event_id
   AND
       x.subclass_value
       =
       y.EventSubClass
WHERE
XE.name IN ( 'Audit Login Failed',
	      'Audit Addlogin Event',
	      'Audit Add DB User Event' )
AND
       x.StartTime
       >
       DATEADD(mi, -5, GETDATE());
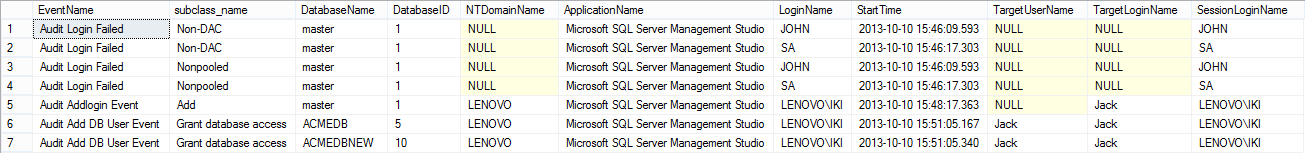
Note that for different event types, different columns are of interest. Others may be obsolete, or simply have no value. For example, the Audit Login Failed event is not related to the TargetUserName field, and the field has no value (it’s NULL). So, the more event types are being captured, the more event specific columns should be queried, which will eventually result in a large number of unnecessary/obsolete captured information
The solution for this problem would be to create and run different SQL scripts for different event types with specific columns to be captured. But, on the other hand, this will result in incompatibility of the results – they could not be all stored in the same table, since the column types and their number differs
Creating SQL Server trace aggregate report
The fn_trace_gettable function can also be used to generate aggregate results. The following SQL example will get all the data from a trace file and create an aggregate result
SELECT
       XE.name AS EventName , X.DatabaseName , X.ApplicationName , X.LoginName ,
COUNT(*) AS TotalCount
  FROM
       dbo.fn_trace_gettable
('C:\Program Files\Microsoft SQL Server\MSSQL11.MSSQLSERVER\MSSQL\LOG\log.trc',
 DEFAULT)X
       JOIN sys.trace_events XE
       ON
       X.EventClass
       =
       XE.trace_event_id
GROUP BY
         XE.name , X.DatabaseName , X.ApplicationName, X.LoginName;

Although the fn_trace_gettable system function provides a solution for querying and saving captured trace information, there are several downsides:
- It requires T-SQL knowledge to gather data
- It needs to be manually scheduled in order not to miss any captured data, since the trace files can get recycled
- There are a number of columns in the default trace files containing various information, and different columns are of interest for different event types. For example, the DatabaseName field is practically not related to the Audit Login Failed event, yet the Audit Login Failed event has a value in the DatabaseName field, so it cannot be omitted
In the next article we’ll describe a solution leveraging the SQL Server traces, the same technology used by SQL Server Profile, with added fault tolerance for captured information, additional processing of captured data, automatic transfers and loading into centralized repository, tamper-evident data storage and more
Downloads
Please download the script(s) associated with this article on our GitHub repository.
Please contact us for any problems or questions with the scripts.
Useful resources
[1] Microsoft SQL Server 2008 Bible, Wiley Publishing, Inc.
[2] Introducing SQL Trace
[3] Create and Run Traces Using Transact-SQL Stored Procedures
[4] Default trace enabled Server Configuration Option
[5] SQL Trace
This article is part of a series
See previous part See all parts See next part
November 8, 2013


