To create a custom system for performance base lining we need the following:
- A metric to track
- A database and tables to store our collected data and processed information
- A means to collect performance data
- A means to process the performance data into meaningful information e.g. Mean, Standard deviation
- A line chart of the data
- A query to create a report of the measurements that exceeded the threshold, we set, for raising alerts
Selecting a performance metric
In this article, the metric we will measure is Batch requests/Sec. This counter represents the number of T-SQL Statements that are being executed by SQL Server per second. This is one of the metrics that gives us the best baseline on how our server is performing.
Creating our data/information store
To capture information about a SQL Server instance you first create a database in which to store information. For this purpose, we’ll create the database PerformanceBaselines
CREATE DATABASE [PerformanceBaselines] ON PRIMARY
( NAME = N'PerformanceBaselines',
  FILENAME = N'E:\Data\PerformanceBaselines.mdf',
  SIZE = 128MB,
  FILEGROWTH = 512MB
) LOG ON
( NAME = N'PerformanceBaselines_log',
  FILENAME = N'E:\Data\PerformanceBaselines_log.ldf',
  SIZE = 128MB,
  FILEGROWTH = 512MB
);
To save the collected metrics collected over time create a table to store the data. Here we’ll create a table to store the ‘Batch Requests/sec’ counter value:
CREATE TABLE [dbo].[BatchRequestsSec]
( [BatchRequestsPerSec] decimal(5,2) NULL,
 [Date] datetime NULL,
 [1stStDev] decimal(5,2) NULL,
 [2ndStDev] decimal(5,2) NULL,
 [Mean] decimal(5,2) NULL, )
ON [PRIMARY]
GO
Collecting performance data
A basic approach is capturing SQL Server performance baselines programmatically with SQL Server Dynamic Management Views. SQL Server 2005 introduced Dynamic Management Views (DMVs). One of them, the sys.dm_os_performance_counters dynamic view, allows capturing a number of SQL Server performance metrics.
By using DMVs, a DBA is able to monitor SQL Server performance in real-time, but also to store collected data in for the purpose of determining baselines and doing comparative analysis in the future.
To view all counters available in the sys.dm_os_performance_counters dynamic view, run the following statement:
SELECT counter_name, cntr_value, cntr_type FROM sys.dm_os_performance_
The cntr_value column represents the current value of the counter.
The cntr_type column is a type of counter defined by Windows performance architecture and defines a method of calculating the actual value of the counter.
The counters (cntr_type 537003264 and 1073939712) require a calculation of the actual counter value from two different records.
A cntr_type with a value 272696576 are the types of the counters where a cntr_value contains a cumulative number. When calculating the actual per-second rate the cntr_value has to be captured twice. The per-second amount is then calculated based on the two cntr_value’s and the number of seconds between collecting the samples.
For example the Batch Requests/sec counter has a cntr_type value 272696576:

Here is our script for capturing the ‘Batch Requests/sec’ counter value and storing the calculated value in a table:
-- Collecting the first sample
DECLARE @first_cntr_value INT;
DECLARE @first_sample_time DATETIME;
SELECT @first_cntr_value = cntr_value,
@first_sample_time = getdate()
FROM sys.dm_os_performance_counters
WHERE LTRIM(RTRIM(OBJECT_NAME)) LIKE '%:SQL Statistics'                                                                                          AND counter_name='Batch Requests/sec'
;

-- Wait time before collecting the second sample

WAITFOR DELAY '00:00:05'

-- Collecting the second sample, calculating per-second value, and inserting into a table

INSERT INTO dbo.BatchRequestsSec
(
    dbo.BatchRequestsSec.BatchRequestsPerSec,
    dbo.BatchRequestsSec.[Date]
)
SELECT (cntr_value - @first_cntr_value) /
DATEDIFF(ss,@first_sample_time, GETDATE()) as BatchRequestsPerSec,
GETDATE() AS [Date]
FROM sys.dm_os_performance_counters
WHERE LTRIM(RTRIM(OBJECT_NAME)) LIKE '%:SQL Statistics'                                                                                          AND counter_name='Batch Requests/sec'
GO
These scripts can be scheduled by a SQL Server Agent job to execute and collect the SQL Server performance metric data from the DMVs in a specified frequency. Our data was set to collect every five minutes for one day.
Converting data to information
In the following example we developed a T-SQL script to calculate the mean, 1st standard deviation, and a 2nd standard deviation per hour from the collected metrics from the DMV for the ‘Batch Requests/sec’ and populated the columns for that period:
USE PerformanceBaselines
GO
DECLARE @i int
SET @i = 23
WHILE @i>=0
BEGIN

--Calculate mean per hour and populate the Mean column

UPDATE PerformanceBaselines.dbo.BatchRequestsSec
SET dbo.BatchRequestsSec.Mean = (SELECT AVG(BatchRequestsPerSec)AS Mean
FROM dbo.BatchRequestsSec brs
WHERE DATEPART(hh, brs.[Date])= @i)
WHERE DATEPART(hh, dbo.BatchRequestsSec.[Date])= @i;

--Calculate 1st standard deviation per hour and populate the 1stStDev column

UPDATE PerformanceBaselines.dbo.BatchRequestsSec
SET dbo.BatchRequestsSec.[1stStDev] = ((SELECT AVG(BatchRequestsPerSec) + (SELECT STDEV(BatchRequestsPerSec)) AS [1stStDev]
FROM dbo.BatchRequestsSec brs
WHERE DATEPART(hh, brs.[Date])= @i))
WHERE DATEPART(hh, dbo.BatchRequestsSec.[Date])= @i;

--Calculate 2nd standard deviation per hour and populate the 2ndStDevr column

UPDATE PerformanceBaselines.dbo.BatchRequestsSec
SET dbo.BatchRequestsSec.[2ndStDev] = ((SELECT AVG(BatchRequestsPerSec) + 2*(SELECT STDEV(BatchRequestsPerSec))AS [2ndStDev]
FROM dbo.BatchRequestsSec brs
WHERE DATEPART(hh, brs.[Date])= @i))
WHERE DATEPART(hh, dbo.BatchRequestsSec.[Date])= @i;

SET @i = @i - 1
END
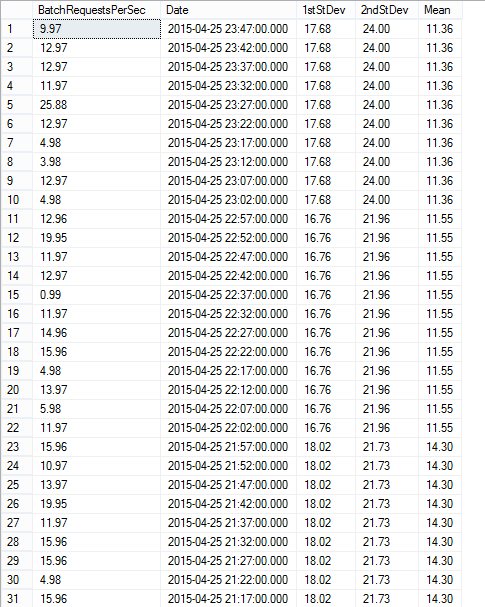
After creating the database and table, and then running data collection scripts, and finally processing the data to do the statistical analysis, you will have data that looks like this:

Visualizing our information
Once we’ve calculated all the statistics we will show the data on a line chart. As you may remember, in our example we have used the Batch Requests/Sec counter. It represents the number of T-SQL command batches received per second by SQL Server.
The Batch Requests/Sec counter is an indicator of how much activity is being processed by our SQL Server. The higher counter’s number tells us that more queries are being executed on our server, however, there is no universal number that can indicate that our SQL Server is too busy, but creating a baseline per hour can give us an insight and help us compare our future measurements with our baselines.
On this chart we show our data plotted with the mean. Since 50% of the data points would be above the mean, it doesn’t help us much for isolating performance anomalies:
Above the 1st standard deviation per hour line is where 5% of measured data lies. It should be used only for lower priority alerts if it should be used at all as too many measurements fall above this threshold to realistically review all of them
The 2nd standard deviation per hour graph (see below) shows where 1% of our highest data points are. With this threshold, we are now able to isolate the measurements that are statistically significant and we may require us to examine further. As you can see below, we’ve successfully isolated 7 measurements
Creating an alert report
We can also create an alerts report of the measurements that exceeded the alert threshold aka two standard deviations from the mean. We have scheduled a SQL Server Agent job to execute the following query to list measurement times and data values for metrics that exceeded the alert threshold so they can be reviewed later and investigated:
SET NOCOUNT ON;
DECLARE @Alert TABLE
(
BatchPersec decimal(5,2),
[2ndStDev] decimal(5,2),
[Date] datetime
);
DECLARE
@BatchRequestsPerSec decimal(5,2),
@2ndStDev AS decimal(5,2),
@date as datetime

DECLARE Treshold CURSOR FOR
SELECT brs.BatchRequestsPerSec, brs.[2ndStDev], brs.[Date]
FROM dbo.BatchRequestsSec brs
ORDER BY brs.[Date]

OPEN Treshold;

FETCH NEXT FROM Treshold INTO @BatchRequestsPerSec, @2ndStDev, @date;
WHILE @@FETCH_STATUS = 0
BEGIN
IF @BatchRequestsPerSec > @2ndStDev

INSERT INTO @Alert VALUES(@BatchRequestsPerSec, @2ndStDev, @date);
FETCH NEXT FROM Treshold INTO @BatchRequestsPerSec, @2ndStDev, @date;
END
CLOSE Treshold;
DEALLOCATE Treshold;

SELECT
[@Alert].BatchPersec,
[@Alert].[2ndStDev],
[@Alert].[Date]
FROM @Alert
ORDER BY [@Alert].[Date]
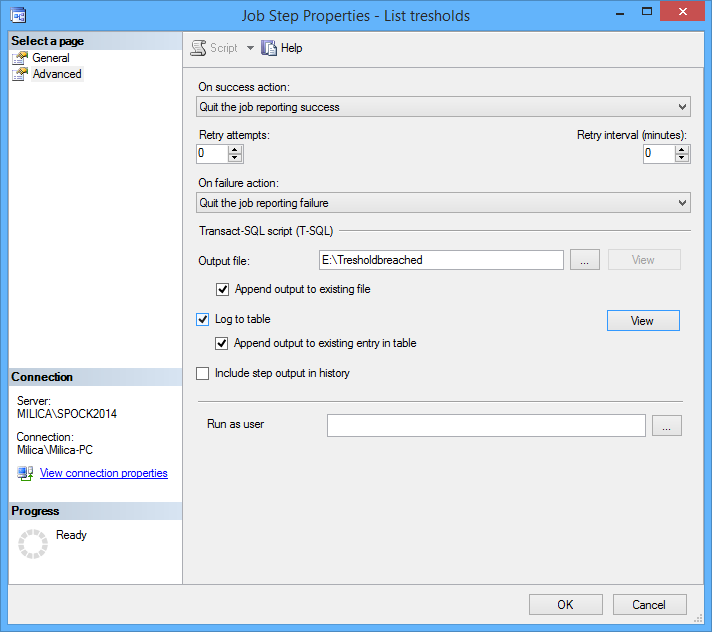
Under the Advanced tab of a job step we have selected the Output file option:
Here is the result of the job saved in a file:
Useful resources:
sys.dm_os_performance_counters (Transact-SQL)
Interpreting the counter values from sys.dm_os_performance_counters
Establishing a Performance Baseline
May 8, 2015


