SQL Server Agent is a Windows service that is widely used by database administrators and developers to automate the different types of critical and complex business and administrative tasks, to be executed based on a regular predefined schedule. It provides us with the ability to schedule an operating system CMD command, PowerShell script, SQL Server Analysis Services command or query, SQL Server Integration Services package or simply a T-SQL script.
The process of creating a SQL Server Agent job is straight-forward including the need to define the steps that contain the logic that the SQL Agent job will execute, in the correct order that meets the business requirements, then pick or define a schedule that will specify the time and frequency of the SQL Agent job execution. In other words, you are able to easily automate and schedule most of your SQL Server database maintenance tasks and business-related tasks, such as processing the application data or purging the system logs.
At the end of the day, after automating and scheduling all the required tasks using the SQL Agent jobs, the developers and business owners will sleep deeply as their tasks will be executed automatically at night, and enjoy their lunch as the tasks will be running during the day without any effort required from their side. But what about the database administrator, who owns the SQL Server that contains hundred of SQL Agent Jobs? These jobs should be controlled and monitored, especially when there is no notification mechanism that is defined on these jobs to notify the job owner if the SQL Agent job failed and what is the reason behind this failure.
In this article, we will discuss how to monitor the SQL Server Agent jobs execution and view detailed information about the execution result of each step within the SQL Server Agent job.
MSDB Overview
MSDB database is a system database that is used by the SQL Server Agent to store system activities about the Database Mail, Service Broker, Database Backup and Restore history, maintenance plans and the SQL Agent jobs. The SQL Server Agent jobs information stored in the MSDB database includes the jobs schedules, steps, alerts and execution history, as shown below:
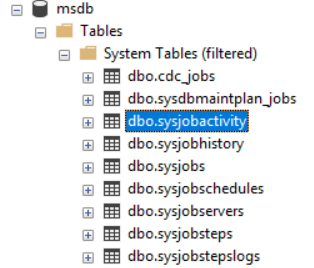
Due to the important information that is stored in the MSDB system database, it is recommended to change the recovery model of that database from Simple to Full recovery model and take a regular backup of that database. In addition, do not try to modify or delete the data stored in the MSDB database tables manually. Instead, you should perform the change properly from the related configuration wizard or using the documented system stored procedure to modify or delete the data.
Sysjobhistory Table
dbo.sysjobhistory table is the MSDB system table that contains detailed historical information about the execution of the SQL Server Agent scheduled jobs. This information includes the SQL Server Agent job step name, the execution result, the execution date, execution time and duration for each step within the job.
In order to get the execution history about a specific SQL Server Agent job, you should join the sysjobhistory table with the sysjobs table, to filter on that Agent job, as in the query below:
SELECT J.[name]
       ,[step_name]
      ,[message]
      ,[run_status]
      ,[run_date]
      ,[run_time]
      ,[run_duration]
  FROM [msdb].[dbo].[sysjobhistory] JH
  JOIN [msdb].[dbo].[sysjobs] J
  ON JH.job_id= J.job_id
  WHERE J.name='Log_Failed_Logins'
And the returned result, that shows the SQL Agent job history, will be like:
sp_help_jobhistory
Rather than querying the system table directly, which is not recommended by Microsoft, you can easily use the sp_help_jobhistory system stored procedure and pass the name of the job that you are interested in checking its history, without the need to have knowledge about the structure of these system tables in order to join between them. The below query can be used to retrieve the history of the same SQL Server Agent job checked in the previous script:
USE msdb;
GO
EXEC dbo.sp_help_jobhistory
    @job_name = N'Log_Failed_Logins';
GO
And the SQL Agent job history returned from that system stored procedure, that contains less details about the steps execution, will be like:
sp_help_jobhistory_full
To retrieve more detailed information about the execution result of the SQL Server Agent job steps, you can use the full copy of the sp_help_jobhistory system stored procedure, that is called sp_help_jobhistory_full. Unfortunately, when executing this system stored procedure, all the parameters are mandatory and should be provided in the execution statement, as in the query below:
EXEC dbo.sp_help_jobhistory_full
   @job_id='3EA411A6-EB6E-416C-AB0F-FAFEF3DBEFB0',
   @job_name = N'Log_Failed_Logins',
   @step_id=NULL,
   @sql_message_id=NULL,
   @sql_severity=NULL,
   @start_run_date=NULL,
   @end_run_date=NULL,
   @start_run_time=NULL,
   @end_run_time=NULL,
   @minimum_run_duration=NULL,
   @run_status=NULL,
   @minimum_retries=NULL,
   @oldest_first=NULL,
   @server=NULL,
   @mode=NULL,
   @order_by=NULL,
   @distributed_job_history=NULL
GO
And the detailed historical information of the SQL Server Agent job, returned from the sp_help_jobhistory_full system stored procedure will be like:
Limitations
Although the previous queries provide us with detailed information about the SQL Server Agent jobs execution, this information still not presented properly. For example, the run_date and run_time columns, that describes the execution date, in YYYYMMDD format, and execution time, in HHMMSS format, of the SQL Agent job step, are stored separately in two different columns, and stored as INT values, instead of displaying it in more meaningful way in one column as datetime value.
In addition, the run_duration column, that is stored as INT data type in HHMMSS format, is also confusing and not friendly when analyzing the execution history of SQL Agent jobs running for long time. In other words, run_duration of 1250, I may read it as 1250 seconds, where in fact it is 12 minutes and 50 seconds. Another point that we need to consider is the shape of the queries result, when trying to check the history for multiple jobs and each job consists of multiple steps.
In order to create a user-friendly report for the SQL Agent jobs execution history, you should have advanced T-SQL development skills that help us in presenting this result in more readable way.
SQL Agent Job Activity Monitor
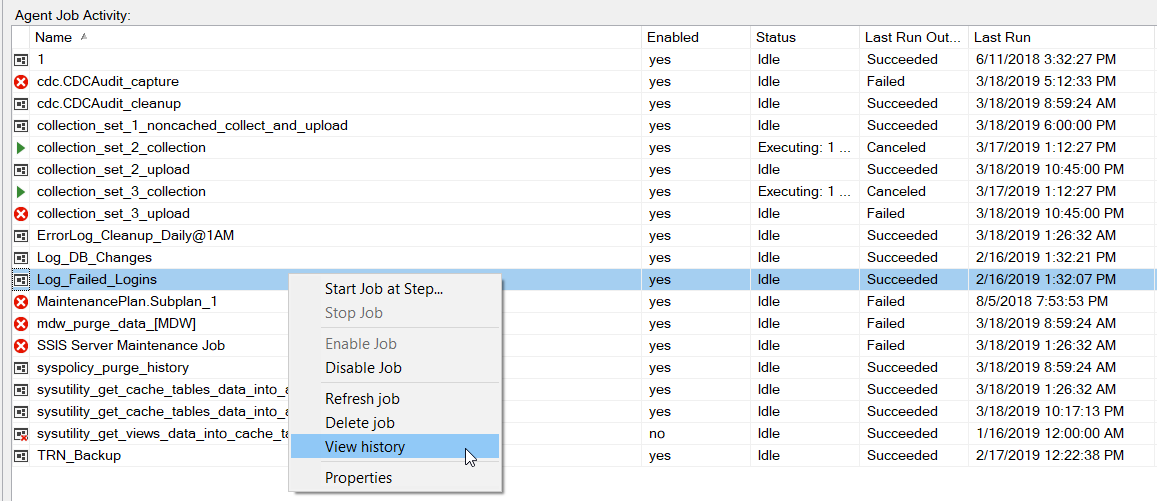
The execution history of the SQL Server Agent jobs can be also checked from the Job Activity Monitor window, under the SQL Server Agent node, as below:
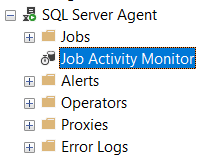
To view the execution history of specific job, right-click on that job and choose the View History option, as below:
The displayed window will show the execution result, for the selected job, including the execution time, duration and result message, with detailed information about the execution result of each step under that job, as shown below:
Notice that there is no option here to check the consolidation view for all the SQL Agent jobs execution history from that windows, as it shows the execution result for the selected job only.
Another option is taking benefits from the ApexSQL Job to review and analyze the history of the SQL Agent jobs under a specific SQL Server instance.
ApexSQL Job
SQL Server Agent jobs are a powerful component to the feature ecosystem of SQL Server, but value-added solutions exist to expand on the capabilities of this technology. One is ApexSQL Job, a 3rd party database automation tool from ApexSQL
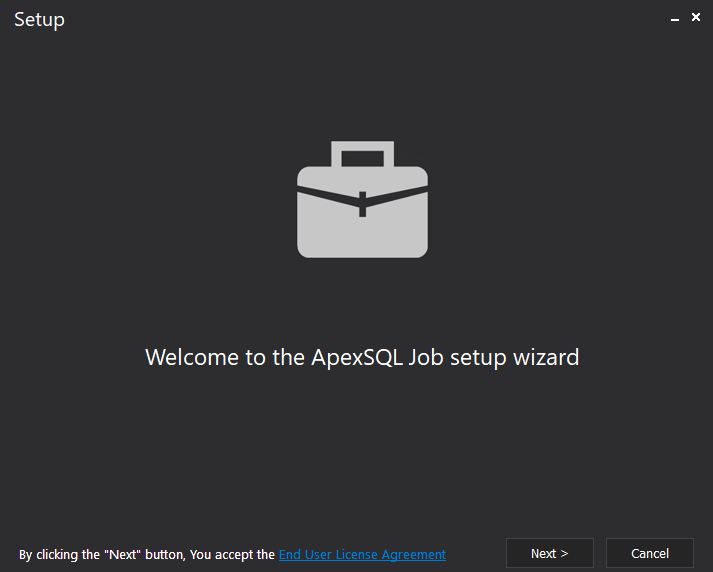
Before installing ApexSQL Job to your machine, you should download the installation file, less than 40MB, from the ApexSQL download center. During the installation process, follow the straight-forward wizard, that will ask you to specify the installation path for ApexSQL Job and if you plan to create a shortcut for the tool in the desktop, for faster access:
Getting started
Once you have ApexSQL Job completely installed to your machine, you can run it by clicking on the “job organization bag” icon:

To connect to your SQL Server instance and check the execution history of the scheduled SQL Agent jobs, click on the Add button, from the SQL Server tasks category, under the Home tab, as follows:

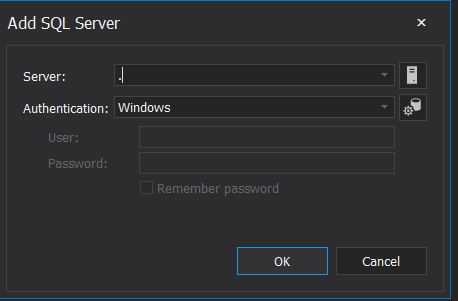
In the Add SQL Server window, provide the name of the SQL Server instance that you plan to connect to, and the authentication mode for the privileged user that you will use to connect to your SQL Server instance, similar to the information you provide when connecting using the SQL Server Management Studio, as shown below:
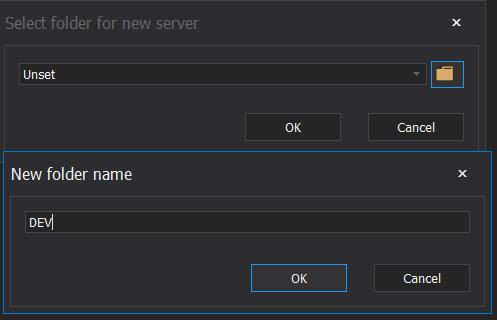
ApexSQL Job, being a centralized administration tool, allows you to connect to multiple SQL Server instances and check the execution history of the scheduled SQL Server Agent jobs from one place. In order perform that, it organizes the servers under customized folders. This is why you will be asked to add the server under the default “Unset” folder, or create a new folder to include your SQL Server instance under it, as shown below:
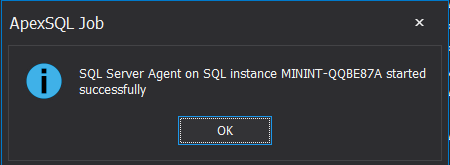
After connecting to your SQL Server instance, you need to make sure that the SQL Server Agent Service, that is responsible for the SQL Agent jobs, is running. To achieve that, click on the Start button, from the Agent tasks category, under the Home tab. If the service is not running, ApexSQL Job will start the it and notify you, as shown below:
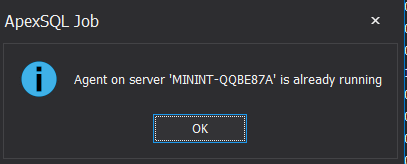
If the SQL server Agent service is already running, no action will be performed, and ApexSQL Job will notify you that it is already running, as below:
View the SQL Agent Jobs list
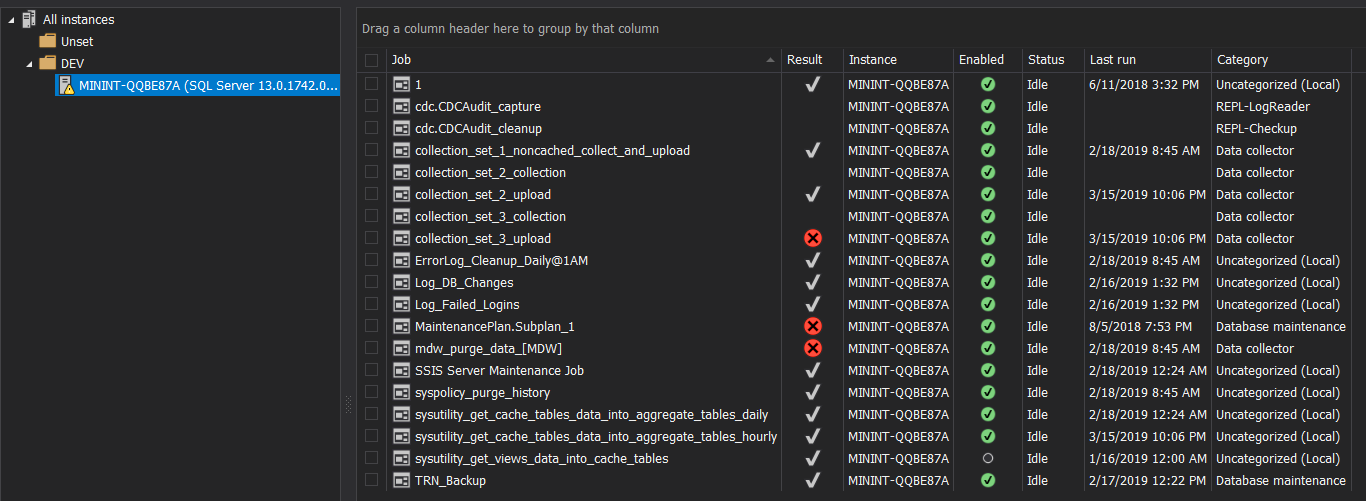
In order to view the list of SQL Server Agent jobs that are defined under your SQL Server instance, choose the SQL Server instance from the folder that you created then click on the Jobs tab, and the list of jobs will be displayed as shown below:
SQL Server Agent Job History
In ApexSQL Job, there is a separate tab, History, from which you can easily check the execution history of the scheduled SQL Agent jobs. If you click on the History tab, you will see that the functions are divided into two categories, Data and View. The Data category contains the functions related to exporting the selected SQL Agent jobs history and refreshing the displayed history. On the other hand, the View category controls the way that the SQL Agent jobs history will be displayed. If you choose the Timeline view option as below:
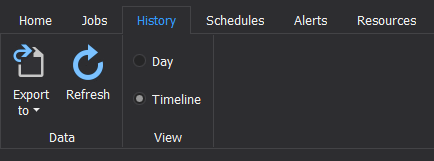
The execution results summary of the scheduled SQL Agent jobs will be displayed in horizontal timeslots of the day, with the ability to move between the days using the top arrows. This summary will show if the SQL Agent job executed successfully or failed, with colorful representation for the SQL Server Agent job status, as shown below:
Changing the view to Day:
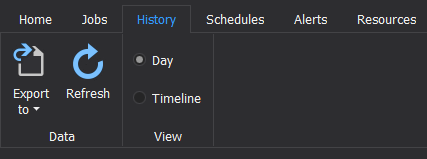
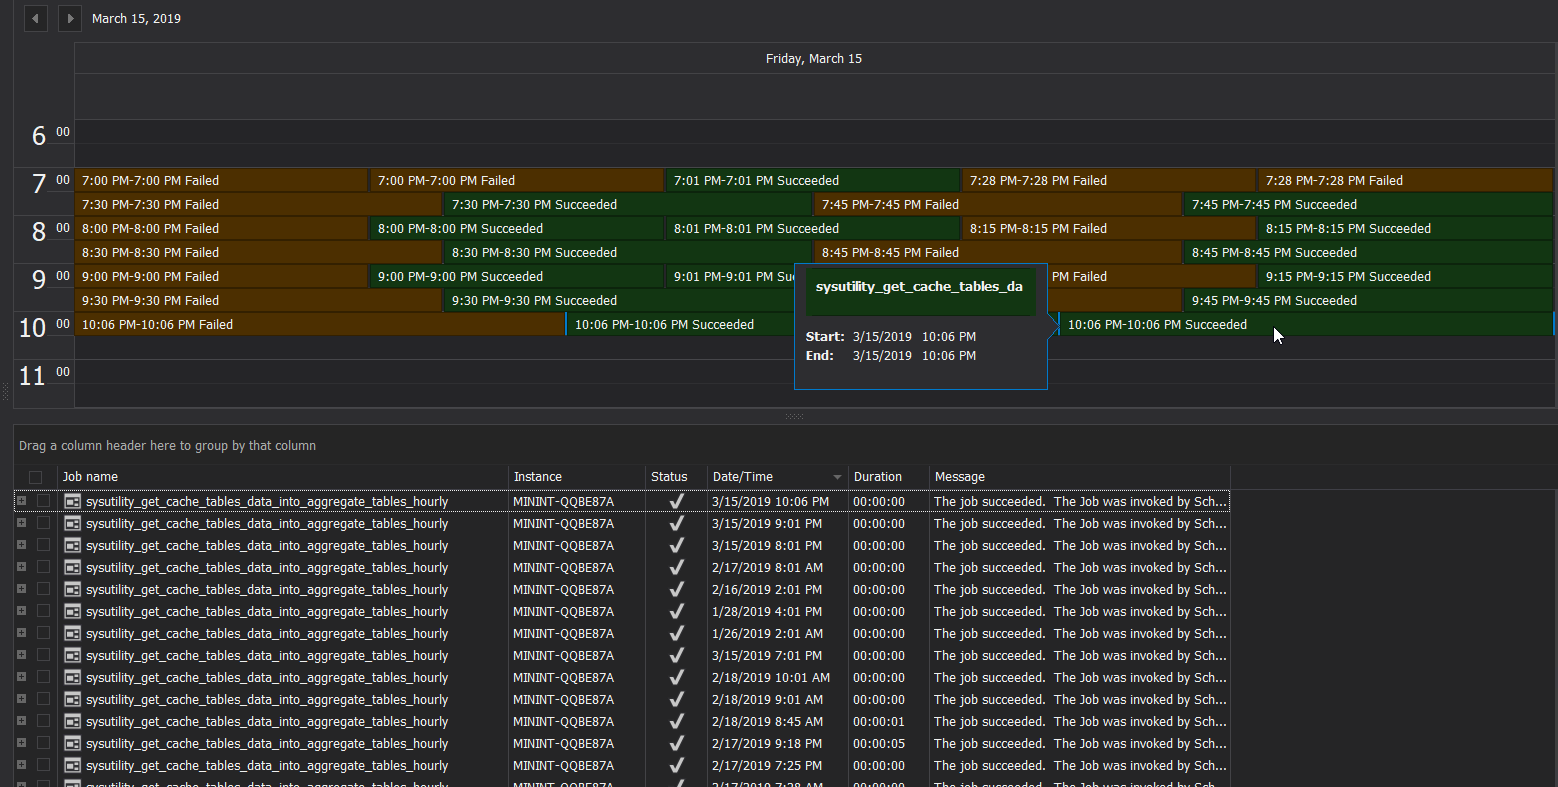
The summary view of the scheduled SQL Agent jobs execution results will be changed to vertical timeslots of the day. The SQL Server Agent job execution summary in this view will show the execution start and end date of that execution attempts with the execution result, Succeeded or Failed, as shown below:
If you click on any execution result, a tooltip will be displayed, showing the job name, and the exact start and end date, in a user-friendly format, as shown below:
The lower part of the SQL Agent jobs history window contains detailed execution history for the selected job. If you click on any timeslot that contains a job execution result, the lower part will display the detailed execution result for the selected slot. This contains the job name, instead of displaying the job id which has no meaning for the user, the SQL Server instance name, the job execution status in graphical format, instead of displaying a bit value of 0 or 1 that may confuse the user, the job execution date and time, in one field and displayed in a user-friendly format that requires no conversion, the job execution duration, in a format that shows the hours, minutes and seconds clearly, and finally a message that describes the execution result of the SQL Server Agent job, with the ability to drag any column name and sort the execution history for the SQL Agent jobs based on the selected column, as shown below:
In addition to the detailed information about the job execution, ApexSQL Job provides us with the ability to expand the job execution result to display the execution result for all the steps executed within the selected job. This comprehensive information will be displayed in hierarchical way, that makes easier to read the parent job execution information and dive down in the execution information for the child steps, as shown below:
It is clear from the previous result, the ability of ApexSQL Job to review the execution history for all the SQL Agent jobs located under the connected server from one window, or simply concentrate on a specific timeslot if the day and see what is executing during that time. Whatever aspect you are interested in, ApexSQL Job will provide you with the ability to analyze your SQL Agent jobs execution from that side.
Export the SQL Server Agent Job History
ApexSQL Job provides us with the ability to export the execution history for the selected SQL Agent jobs to multiple formats. This includes exporting the execution history to CSV, XML, HTML and PDF formats. To do that, on the lower part of the execution history window, select the jobs execution history logs that you plan to export, right-click on the window and choose the Export to option then choose the format for the file to which this history will be exported to, as shown below:
Once the exported is completed successfully, ApexSQL Job will ask you to open the generated file for viewing, as shown below:
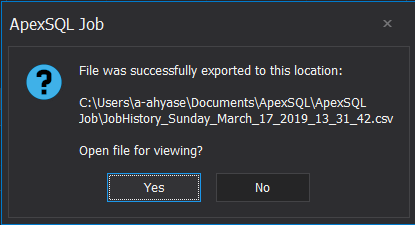
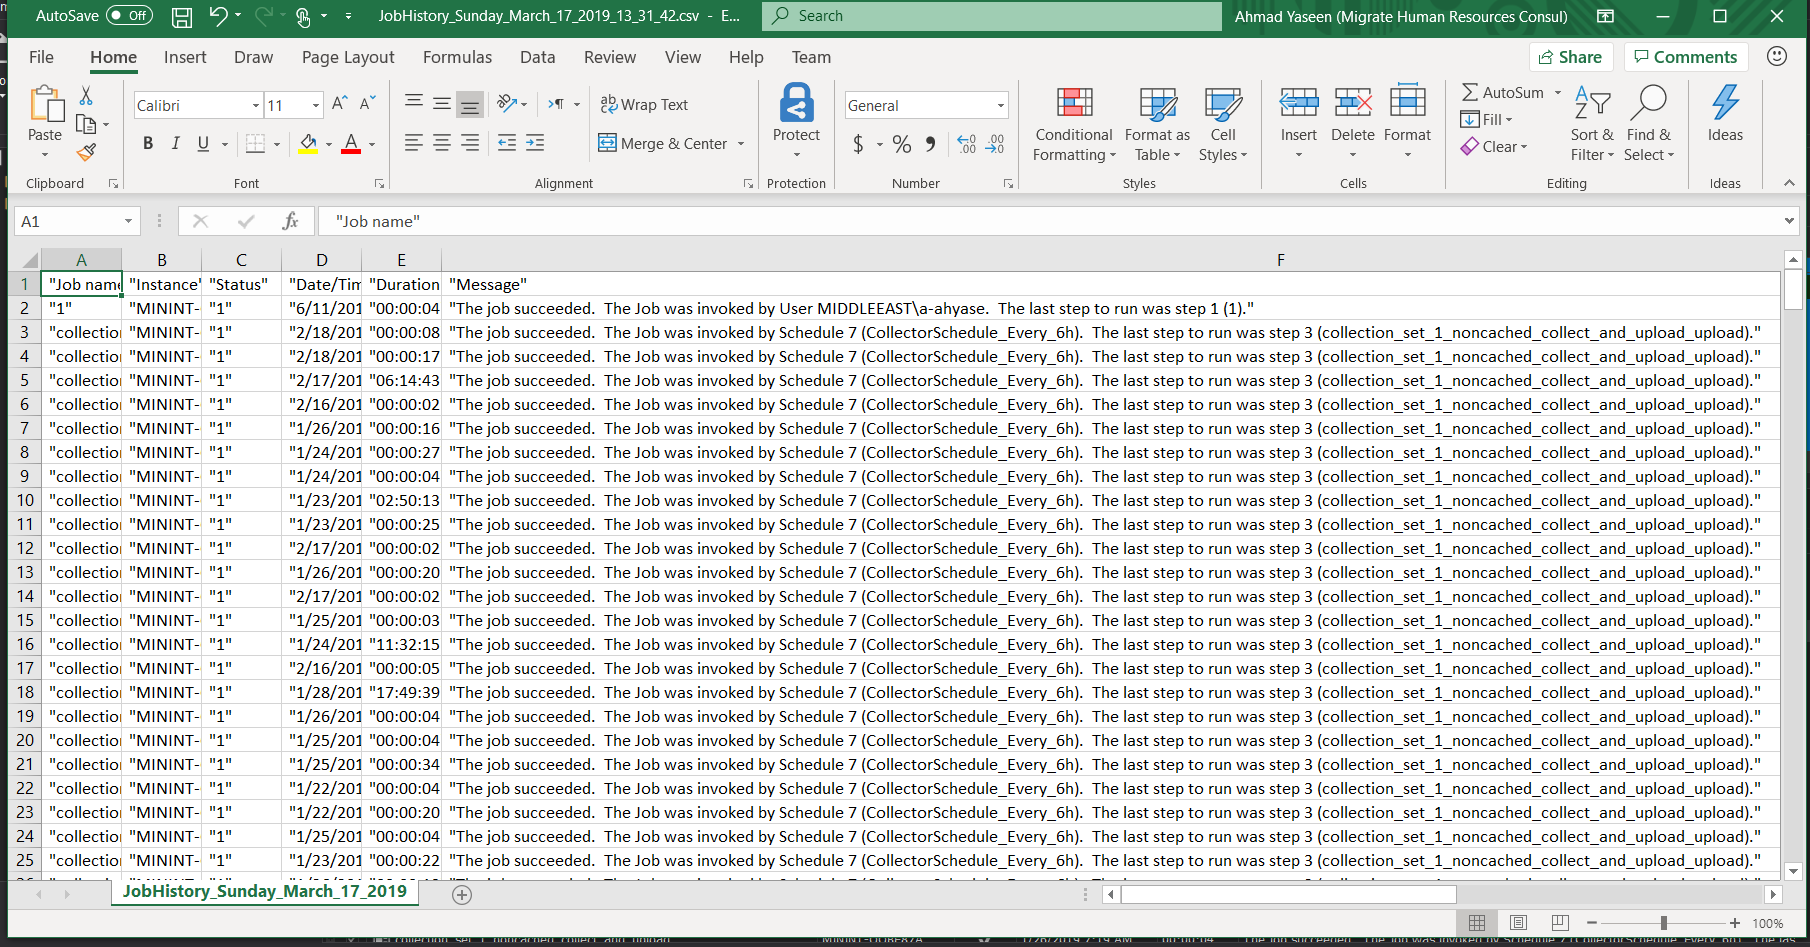
If you click Yes, the file that contains the execution history for the selected SQL Server Agent job will be opened, where you can keep that file and analyze it in the future, or attach it to your email or report as a proof for the related team, as below:
March 22, 2019


