


The AlwaysOn Availability Group was introduced as a new feature in the SQL Server 2012 Enterprise edition and is designed to ensure a more advanced and reliable option for SQL Server high availability and disaster recovery.
To understand the complexity of AlwaysOn availability group monitoring, it is necessary to understand that AlwaysOn is the mixture of Failover Cluster Instance (FCI) and SQL Server database mirroring, or better say synergy of the best of clustering and mirroring folded in the single feature
Unlike when monitoring the Failover cluster or mirroring where passive/secondary components are inactive, AlwaysOn Availability Group allows user interaction with the secondary databases directly which are the active components and thus require constant monitoring. What’s more, with AlwaysOn the failover is possible for a single database, a group of databases or for the entire SQL Server instance. In addition, the AlwaysOn availability group allows the user to create more than one failover target and to have full control of the failover process.
All these new and advanced things introduced in SQL Server with AlwaysOn Availability Groups, increased the need for stricter and more precise monitoring to ensure that AlwaysOn availability group set up is appropriate and that it is working properly.
To meet these demands, DBAs can reach for native, built-in monitoring solutions by using the AlwaysOn dashboard in SQL Server Management Studio, T-SQL scripts for direct querying of the AlwaysOn dedicated DMVs or using Performance Monitor. Finally, the proper monitoring process requires timely notification on AlwaysOn status changes/issues to be sent to DBA, so appropriate alerting must be implemented
SSMS AlwaysOn Dashboard
T-SQL scrips monitoring
Performance Monitor
AlwaysOn Availability Group alerting
SQL Server Management Studio AlwaysOn Dashboard
Probably the easiest way for monitoring AlwaysOn Availability Group performance and status is via the built-in dashboard in SQL Server Management Studio (SSMS). By default, the SSMS dashboard shows very basic information (which is not enough for proper monitoring), and this information can be customized by users to display more info about the replicas and the Availability Group databases.
The feature used for monitoring AlwaysOn Availability Group is the AlwaysOn dashboard. The AlwaysOn dashboard is available within SSMS from the Availability Groups subfolder context menu of the AlwaysOn High Availability folder
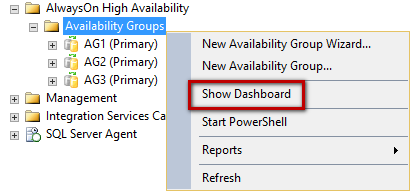
After selecting the show dashboard command from the context menu, the new tab will be opened which displays the information about available AlwaysOn Availability Groups, including the primary instance and the failover mode applied and issues. The Issues column will be empty if no issues are encountered, and only in the case, there are some issues with AlwaysOn Availability Group, the link to troubleshooting documentation will be displayed
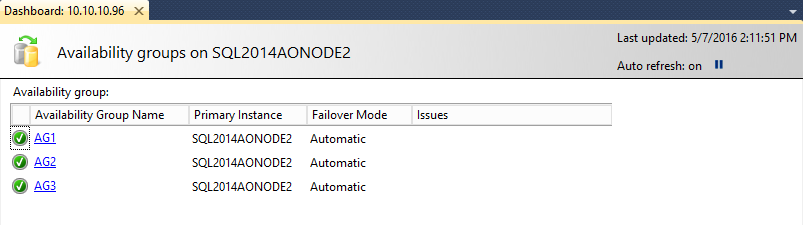
Now, by selecting the availability group name link, the new tab will be opened with details about the selected availability group
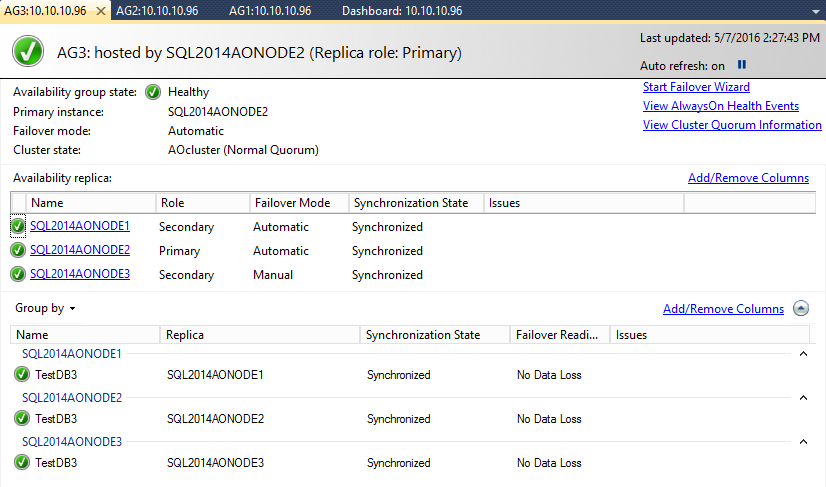
The first information that should be reviewed here is the Availability group state, and as long as it indicates the state is Healthy it is OK
The Availability replica section shows all the instances that belong to this availability group, their role, failover mode and synchronization state for each instance. There is one exception here, which is important, and it is when the availability mode is defined as an Asynchronous commit, the secondary replicas will never display the state as “synchronized”. In this particular case, the secondary databases are mostly delayed behind to the primary database and thus they are generally out of sync (even it is possible that under some circumstances secondary could be synchronized with primary replica)
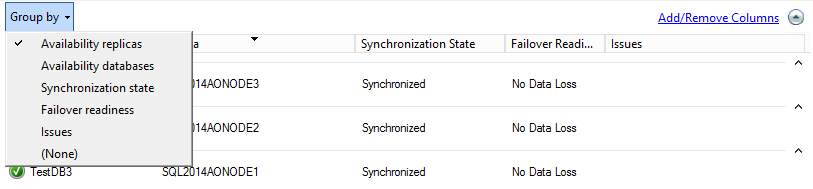
The Group by section displays all availability group database in each availability group replica individually. This section can be presented in a different way by selecting the different type of grouping
As mentioned at the beginning, the default view is quite limited and offers just very basic information, but it allows additional customization that can ensure detailed insights into the availability group state and system
Additional columns can be added via Add/Remove Columns link on the far right side of each section, or from the context menu when right-clicking on any column headings
Availability replica section

Databases section

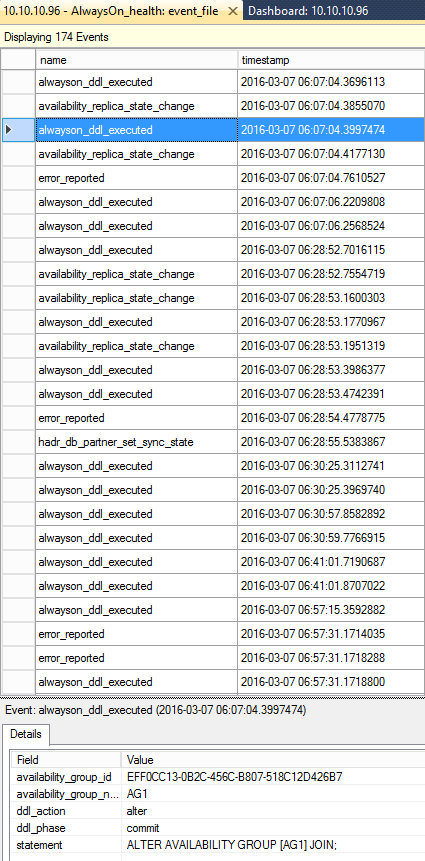
The View AlwaysOn Health Events link will provide some additional information via the AlwaysOn_health extended events session that creates automatically on creating the availability group
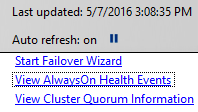
The link will display all the events collected by the AlwaysOn_health extended events session and detailed info for the event that is selected and this is also a historical break down of events occurred on the specified availability group
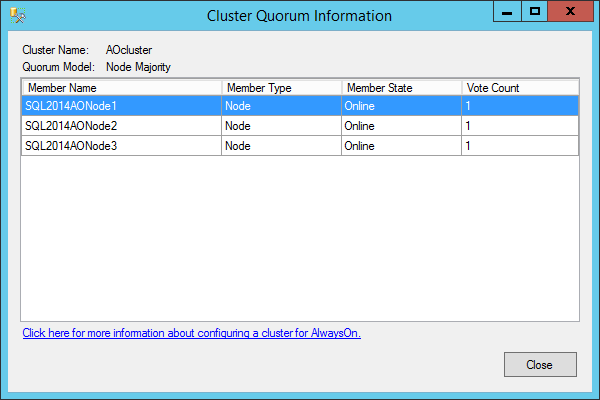
The View Cluster Quorum Information is a feature that will allow the user to preview the data for the Windows Service Failover Cluster (WSFC) quorum
T-SQL scripts based monitoring of AlwaysOn
For users who have wanted to have full control and the monitored data presented and tailored according to their needs, Microsoft has introduced a set of new DMVs that can be used for collecting all the necessary information for monitoring the AlwaysOn Availability Group. For more information about the DMVs including the parameters description can be found in the Monitor Availability Groups (Transact-SQL) msdn article
|
Quick tip: AlwaysOn Availability Group Catalog Views require View Any Definition permission on the monitored SQL Server instance. AlwaysOn Availability Groups Dynamic Management Views require View Server State permission on the server. |
In general, all information necessary for AlwaysOn monitoring can be obtained from SQL Server using the below set of queries
SELECT *
FROM sys.availability_groups;

SELECT *
FROM sys.availability_groups_cluster;

SELECT *
FROM sys.availability_group_listeners;

SELECT *
FROM sys.availability_group_listener_ip_addresses;

SELECT *
FROM sys.availability_replicas;

SELECT *
FROM sys.dm_hadr_availability_group_states;

SELECT *
FROM sys.dm_hadr_availability_replica_cluster_nodes;

SELECT *
FROM sys.dm_hadr_availability_replica_cluster_states;

SELECT *
FROM sys.dm_hadr_availability_replica_states;

SELECT *
FROM sys.dm_hadr_auto_page_repair;

SELECT *
FROM sys.dm_hadr_cluster;

SELECT *
FROM sys.dm_hadr_cluster_members;

SELECT *
FROM sys.dm_hadr_cluster_networks;

SELECT *
FROM sys.dm_hadr_database_replica_states;

SELECT *
FROM sys.dm_hadr_database_replica_cluster_states;

SELECT *
FROM sys.dm_tcp_listener_states;
Performance Monitor
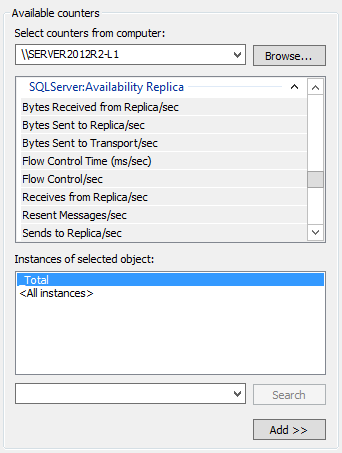
The third native solution that can be used for AlwaysOn Availability Group performance monitoring is the use of performance counters via the Performance Monitor. For that purpose, Microsoft has added new objects with number of different counters: SQLServer:Availability Replica and SQLServer:Database Replica
SQLServer:Availability Replica consists of performance counters that returns performance data of the AlwaysOn replicas. All performance counters in this group are valid for both – the primary and the secondary replicas, while the send/receive counters are related to the local replica
The object’s counters with description according to Microsoft msdn1
| Counter Name | Description |
| Bytes Received from Replica/sec | Number of bytes received from the availability replica per second. Pings and status updates will generate network traffic even on databases with no user updates. |
| Bytes Sent to Replica/sec | Number of bytes sent to the remote availability replica per second. On the primary replica this is the number of bytes sent to the secondary replica. On the secondary replica this is the number of bytes sent to the primary replica. |
| Bytes Sent to Transport/sec | Actual number of bytes sent per second over the network to the remote availability replica. On the primary replica this is the number of bytes sent to the secondary replica. On the secondary replica this is the number of bytes sent to the primary replica. |
| Flow Control Time (ms/sec) | Time in milliseconds that log stream messages waited for send flow control, in the last second. |
| Flow Control/sec | Number of times flow-control initiated in the last second. Flow Control Time (ms/sec) divided by Flow Control/sec is the average time per wait. |
| Receives from Replica/sec | Number of AlwaysOn messages received from the replica per second. |
| Resent Messages/sec | Number of AlwaysOn messages resent in the last second. |
| Sends to Replica/sec | Number of AlwaysOn messages sent to this availability replica per second. |
| Sends to Transport/sec | Actual number of AlwaysOn messages sent per second over the network to the remote availability replica. On the primary replica, this is the number of messages sent to the secondary replica. On the secondary replica, this is the number of messages sent to the primary replica. |
SQLServer:Database Replica consists of performance counters that are returning performance info about the databases on the secondary replica of an AlwaysOn availability group. The SQLServer:Database Replica object can be used only for SQL Server instance databases hosted by a secondary replica.
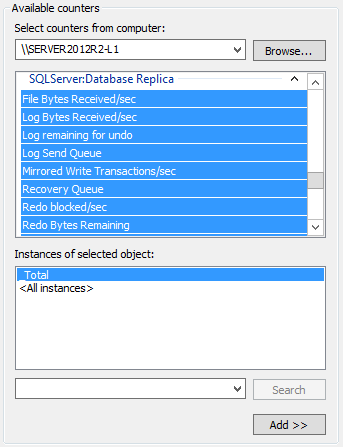
The object’s counters with description according to Microsoft msdn2
| Counter Name | Description | View on… |
| File Bytes Received/sec | Amount of FILESTREAM data received by the secondary replica for the secondary database in the last second. | Secondary replica |
| Log Bytes Received/sec | Amount of log records received by the secondary replica for the database in the last second. | Secondary replica |
| Log remaining for undo | The amount of log in kilobytes remaining to complete the undo phase. | Secondary replica |
| Log Send Queue | Amount of log records in the log files of the primary database, in kilobytes, that has not yet been sent to the secondary replica. This value is sent to the secondary replica from the primary replica. Queue size does not include FILESTREAM files that are sent to a secondary. | Secondary replica |
| Mirrored Write Transaction/sec | Number of transactions that wrote to the mirrored database and waited for the log to be sent to the mirror in order to commit, in the last second. | Primary replica |
| Recovery Queue | Amount of log records in the log files of the secondary replica that has not yet been redone. | Secondary replica |
| Redo Bytes Remaining | The amount of log in kilobytes remaining to be redone to finish the reverting phase. | Secondary replica |
| Redone Bytes/sec | Amount of log records redone on the secondary database in the last second. | Secondary replica |
| Total Log requiring undo | Total kilobytes of log that must be undone. | Secondary replica |
| Transaction Delay | Delay in waiting for unterminated commit acknowledgement, in milliseconds. | Primary replica |
These counters are also available via sys.dm_os_performance_counters Dynamic Management View
Using the Performance Monitor imposes some limitations when monitoring an AlwaysOn environment as the objects are useable only on the secondary replica of the SQL Server instance. This imposes the need on the user to add Performance Monitor object for each secondary replica in the AlwaysOn availability group in order to have the info about the databases hosted on the secondary replicas
The drawback of these native solutions for monitoring AlwaysOn is that the info that a user can get depends on the replica he is looking at. Collecting the data from the different secondary replica will return the different information, as none of the secondary replica is not aware of the other replica in the system. The primary replica is the only one that has full info about all replicas in the AlwaysOn availability group. Therefore, it could be tricky sometimes to collect all the necessary info to make the complete picture of the AlwaysOn system, which is more pronounced with the larger number of replicas in the AlwaysOn availability group
Alerting on issues with AlwaysOn Availability Group
The monitoring itself is an important element of maintaining the AlwaysOn availability group functionality in a perfect state, but when an issue occurs it is important that DBA is aware of that issue as soon as possible, so having alerts that will send a notification to DBA are essential and must have in the monitoring process
Using SQL Server Agent Alerts is the best way to be informed about issues on a timely basis, and depending on the way alerts are set this could also serve as a proactive monitoring of AlwaysOn Availability Groups. SQL Server Agent Alerts comprises some dedicated out-of-the-box alerts specifically designed for AlwaysOn Availability Group. SQL Server will fire an error code on each AlwaysOn issue. To take a look at available error codes and error description the following script can be used
SELECT message_id
	,TEXT
FROM sys.messages
WHERE TEXT LIKE ('%availability%')
	AND language_id = 1033
It will list 293 available error codes for AlwaysOn Availability Group. By reviewing the error codes and alert description the ones that require attention in specified environment could be used for setting up alerts
Below are the suggested list error codes with descriptions for which configuring alerts is recommended
| 976 | The target database cannot be queried. Either data movement is suspended or the availability replica is not enabled for read access. |
| 983 | The availability database is not accessible and reason needs to be investigated |
| 1480 | The AlwaysOn Availability Group has failed over. The reason for failing over should be examined. This is an informational message only. |
| 19406 | The state of the local availability replica has changed. Reason should be investigated |
| 35254 | An error occurred while accessing the availability group metadata. Check and investigate the root cause of this error |
| 35262 | This is informational error and it indicates that the default startup of database will be skipped as database is member of an availability group |
| 35273 | Bypassing recovery since availability group database is marked as inaccessible, because the session with the primary replica was interrupted or the WSFC node lacks quorum endpoint configuration |
| 35274 | An availability database recovery is pending while waiting for the secondary replica to receive transaction log from the primary |
| 35275 | The availability database is in a potentially damaged state, and as such, it cannot be joined to the availability group. Restoring and rejoining database is recommended |
| 35276 | This error indicates that manual intervention could be needed to restart the synchronization of the database. If the problem is persistent, the restart of the local SQL Server might be required. |
| 35279 | The primary replica rejected joining of the new database to availability group due to error. |
| 35299 | Info message that some nonqualified transactions are being rolled back in database for an AlwaysOn change of state. |
| 41048 | Local Windows Server Failover Clustering service is not available |
| 41049 | Local Windows Server Failover Clustering node is not online anymore |
| 41050 | Waiting for the start of a local Windows Server Failover Clustering service |
| 41051 | Local Windows Server Failover Clustering service started |
| 41052 | AlwaysOn Availability Groups: Waiting for local Windows Server Failover Clustering node to start. This is an informational message only. No user action is required. |
| 41053 | AlwaysOn Availability Groups: Local Windows Server Failover Clustering node started. This is an informational message only. No user action is required. |
| 41054 | AlwaysOn Availability Groups: Waiting for the local Windows Server Failover Clustering node to come online. This is an informational message only. No user action is required. |
| 41055 | AlwaysOn Availability Groups: Local Windows Server Failover Clustering node is online. This is an informational message only. No user action is required. |
| 41089 | AlwaysOn Availability Groups startup has been canceled because SQL Server is shutting down. This is an informational message only. No user action is required. |
| 41091 | The local AlwaysOn availability group replica is going offline because the lease expired or lease renewal failed |
| 41131 | Bring availability group online has been failed. Verify that the local Windows Server Failover Clustering (WSFC) node is online |
| 41406 | The availability group is prepared for automatic failover due to the secondary replica is not ready for an automatic failover. The secondary replica is unavailable, or its data synchronization state is currently not in the SYNCHRONIZED synchronization state. |
| 41414 | At least one secondary replica is not connected to the primary replica and the indicated connected state is DISCONNECTED. |
| 41421 | Availability database is suspended. |
To configure alerts, the first item that needs to be configured is the Operator that will be used for alerts. Creating operators is possible via T-SQL script or using SSMS
The example script for creating the new operator
USE msdb
GO

EXEC msdb.dbo.sp_add_operator @name = N'ApexSQL TestDBA',
	@enabled = 1,
	@email_address = N'TestDBA@ApexSQL.com',
	@pager_address = N'6033858574@pager.ApexSQL.com',
	@weekday_pager_start_time = 090000,
	@weekday_pager_end_time = 190000,
	@pager_days = 62;
To create an operator using the SSMS
-
Start SQL Server Management Studio
-
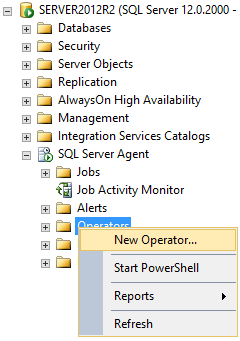
Expand the SQL Server Agent node in the Object Explorer pane. Select New Operator from the context menu of the Operators folder
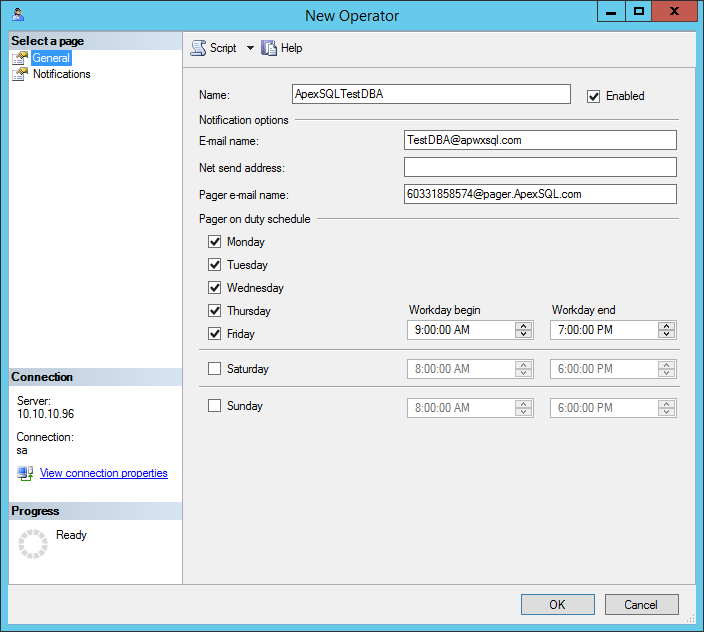
The New Operator dialog will appear. Here define the name of the operator and set up notification options: E-mail name, Net send address, and Pager e-mail name
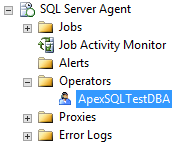
The operator is created now
Creating alerts for AlwaysOn Availability Groups
The next step is creating the alerts for the error numbers of the user choice. Here will be presented one example, and by following these steps, alerts for any of the error code can be created
Using T-SQL Script
The following script example will create the alert for the error code 1480. To create alerts for the other error codes using this script, change the value for @name (use the appropriate name for alert) and use the appropriate error code for the @message_id parameter. The rest of the script can be left unchanged
USE [msdb]
GO

EXEC msdb.dbo.sp_add_alert @name = N'AlwaysOn role change (failover)',
	@message_id = 1480,
	@severity = 0,
	@enabled = 1,
	@delay_between_responses = 0,
	@include_event_description_in = 0,
	@job_id = N'00000000-0000-0000-0000-000000000000'
GO

EXEC msdb.dbo.sp_add_notification @alert_name = N'AlwaysOn role change (failover)',
	@operator_name = N'ApexSQLTestDBA',
	@notification_method = 3
GO
Using SSMS
-
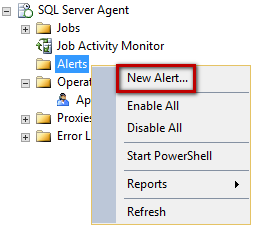
Select New Alert from the Alerts folder context menu in the Object Explorer pane
-
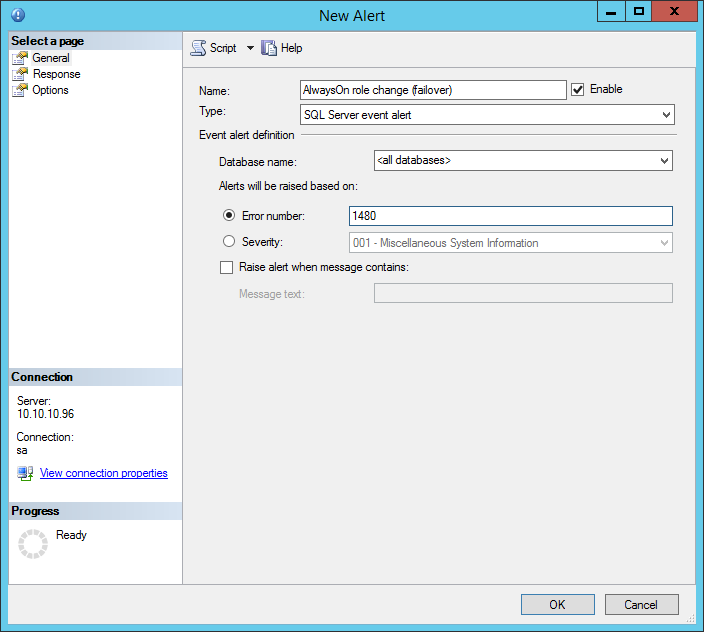
In the New Alert dialog, set the alert name, make sure that the Enable checkbox is selected, set Type as SQL Server event alert and enter the adequate error number in the Error number field (in our example this is the 1480)
-
Under the Response tab check the Notify operators checkbox and for the created operator listed under the Operator list check the E-mail and Pager checkboxes

-
Under the Options tab, check the E-mail and Pager checkboxes under the Include alert error text in section, to ensure that error message text will be included in the email or pager message

- AlwaysOn Availability Groups Troubleshooting and Monitoring Guide
- Use the AlwaysOn Dashboard (SQL Server Management Studio)
- Monitor Availability Groups (Transact-SQL)
- AlwaysOn Extended Events
- Always On Availability Groups Catalog Views (Transact-SQL)
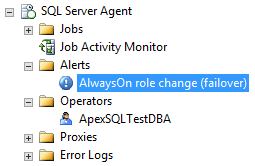
The new alert is now created
Once alerts have been set for all desired error numbers for AlwaysOn error alerting, alerts will be triggered whenever an error occurs which generates an error code that matches one of the codes defined in alerts. With each alert, an email and/or pager message will be sent to a selected operator. Being aware of AlwaysOn issues in a timely manner, the database administrator will be in position to quickly respond, examine the root cause of the error and resolve the issue
Additional resources
May 19, 2016


