


SQL blocking means that one or multiple SQL queries are waiting for resources that are locked by another SQL Query. SQL blocking can affect data throughput and SQL Server responsiveness significantly. SQL Server response time is a measure that shows how long the end user that has executed a query must wait until he gets a response. So, in case that a query is doing nothing while waiting on another query to release the lock on the target resource, the response time increases thus making the SQL Server less responsive.
At the other hand, when talking about the data throughput, the measure is the number of simultaneous users who are logged and execute their queries in parallel without slowing down the SQL Server. Moreover, this is the SQL Server performance parameter that could be severely affected when blocking chain occurs. In scenarios were complex blocking chains occurs where one SQL query blocks another, and that query then blocks the third one, and the third one blocks the fourth one, and so on the blocking of the critical SQL Server resources for a prolonged time could occur. That creates a sort of artificial serialization in accessing key resources to the level where only one or eventually two users are effectively using SQL Server at one time.
Both of these scenarios are something that should be avoided and prevented.
SQL Server blocking is hard to identify and troubleshoot as it is hard to predict such behavior during development when only a limited number of users, quite often only one or two, are executing and testing the queries against the SQL Server at the same time. It is even worse to predict the situations where a single rarely executed query can cause a lengthy and complex blocking chain, making the troubleshooting process of bad SQL Server performance caused by such a rare and complex blocking chain annoying and often without results.
- For more information SQL Server blocking read the Techniques to identify blocking queries and causes of SQL Server blocks article.
As it can be seen in the article, establishing the SQL Server blocks monitoring and tracking of even simple SQL Server blocks is not an easy and straightforward process. Even when the significant time is invested, results could be vague in most cases.
The situation where blocking chain is the cause of the issue is even more complicated for monitoring and troubleshooting. It’s quite tough to pinpoint the head blocker of the blocking chain when there are a number of processes involved. Moreover, if we add the possibility that deadlocks could be involved in the blocking chain as well, there could be quite a mess that has to be resolved and tracked.
Just as an example of the blocking chain, the scenario where a chain of the three SQL blocking processes will be simulated. Simulating such a blocking chain requires four separate connections to the SQL Server database to be created. That means that each query must be executed from a separate query tab in the SQL Server Management Studio. The Adventure Works database will be used in the blocking chain example.
SSMS tab1:
In this window, the query will start a transaction that will select from the database table and then for the purpose of easier simulation the waitfor delay command will be executed to create the 15 seconds wait for more comfortable work and unambiguous results presentation. The query will force the locks just for the purpose of the presentation. Otherwise, that is not recommended without a very particular reason.
begin tran

select * from [Person].[Person] with (tablock, holdlock, xlock)
waitfor delay '00:00:15'

commit tran
SSMS tab2:
The query in tab 2 should be executed immediately after the previous query in tab 1. The transaction will try to select from the same table, and that will conflict with the transaction in the tab1 that holds the lock.
select * from [Person].[Person]
SSMS tab3:
Finally, in tab 3 the select query will be executed after the tab 2 query, and it will conflict with the query in the tab 2.
select * from [Person].[Person]
SSMS tab4:
This query in tab 4 is designed to display the active SQL blocking and should be executed after the query in tab 3 is executed. In our example, SQL Server used for this example had a very few active processes, so we were able to get insight straight into results.
Select Session_ID,Blocking_Session_ID
 From Sys.DM_Exec_Requests
 Where Session_ID > 50
 And Blocking_Session_Id <> 0
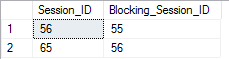
What we can see from this result is that session 65 is waiting for session 56 to release the lock it holds on the resource, and it can be seen that session 56 is waiting for session 55 to release the acquired lock. Moreover, it is evident that session 52 is not waiting for anything, so one could assume that session 52 is the root cause of the SQL blocking or the so-called head blocker.
While this could look like a simple to troubleshoot, it is not the case in the real world. Production servers might have hundreds or thousands processes where numerous blocks could occur and blocking chains could reach tens of levels. Analyzing such results manually and figuring out relations and connections between processes cod take a lot of time and are prone to mistakes or misinterpretations.
At the top of that, this is not the information that is stored somewhere, so it doesn’t allow any insight into the history and frequency of SQL blockings and blocking chains.
March 4, 2019


