


In aggregate, SQL Server Wait statistics are complex, comprising hundreds of wait types registered with every execution of the query. So, to better understand how and why the wait statistic, in general, is the most important for detecting and troubleshooting SQL Server performance issues, it is important to understand the mechanism of how a query executes on SQL Server, since SQL Server performance problems are the ones that most often affect end users.
SQL Server processing is based on query execution, and most of the performance problems are related to queries executed against the SQL Server.
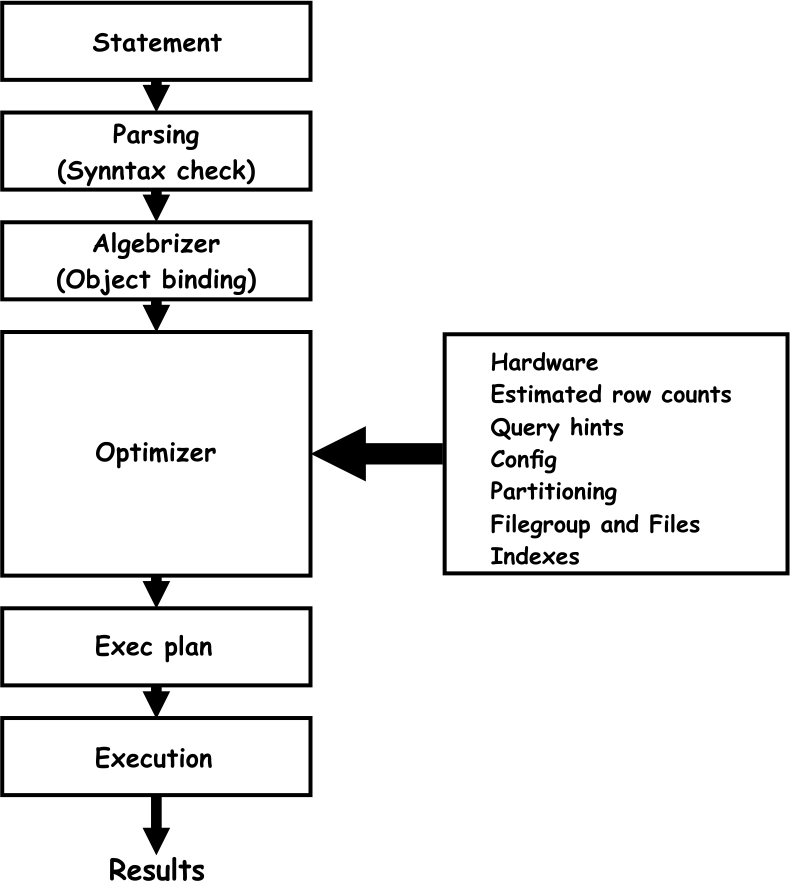
The query execution flow graphic is simplified to a certain level for easier understanding of the basic steps in query execution. Every query execution starts with the actual T-SQL statement, and when the user runs the statement, it goes through the execution steps as elaborated below:
Parsing (Syntax check) – this is the first stage in the processing of the T-SQL statement. Once the application runs the statement, it issues a parse call to SQL Server. During the parse phase, SQL Server performs the following:
- Validates the syntax of the executed T-SQL statement
- Validates that the process that issued the statement has appropriate privileges to execute that statement
- Reserves a SQL statement private area
In case that any error occurs here, the SQL Server parser engine returns the appropriate error information.
Algebrizer (Object verification) – Once the parser engine verifies the T-SQL statement as valid, it passes the statement to the algebrizer. The algebrizer performs the following tasks:
- Verifies that objects and columns names provided in the query or referenced by the query exist in the target database. If an object referenced in the T-SQL script does not exist in the database, the algebrizer returns appropriate error information. For example, if a query uses the wrong name of a column, the algebrizer identifies that such a column does not exist in the target database and generates an error
- Identifies and verifies all data types (i.e. uniqueidentifier, datetime, int…) defined in a T-SQL statement
- Inspects and validates that columns in GROUP BY statements are properly placed. If not, the algebrizer returns an error
Optimizer – It is in charge of generating the most optimal execution plan for the given query by analyzing various data related to the query execution. The optimizer uses various data as input information to create a query plan, such as:
- Hardware used for the query execution
- Estimated row count that affects by the query
- Analysis of the hints used in the query (when statements is forcing the query to use the specific index for example) that can force specific way of execution
- Configuration parameters set (MAXDOP value for example)
- Information about indexes that should be used during the query execution
- Analysis of the use of partitioning, filegroups and files
Those are all factors that query optimizer gathers for analysis and for creating an appropriate execution plan. The SQL query optimizer uses all that information to create multiple execution plan candidates, and then it picks the one that is the most cost-effective. The SQL Server optimizer is cost-based, and it uses a cost estimation model to determine the final cost of different execution plan candidates. So, the query with the lowest cost will be selected and sent along to the SQL Server execution engine.
Execution – this is the step where SQL Server takes the execution plan, passed by the optimizer, and executes it. To perform the execution, it performs multiple functions, such as:
- Dispatches all the commands contained in the execution plan
- Iterates through all execution plan commands until it completes execution
- Cooperates with the SQL Server storage engine to get and store/update data in tables and indexes
Wait statistics
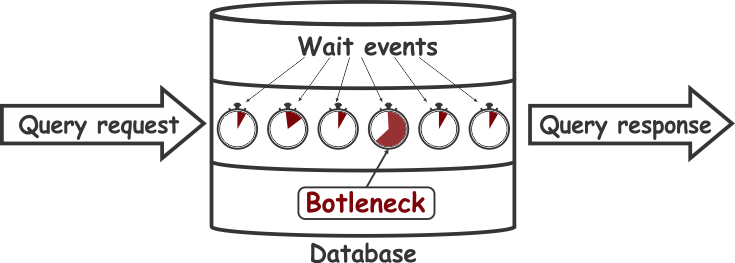
SQL Server has the mechanisms to monitor query execution, and it logs not just the total time needed for a query to complete the execution, but also how long and on what the query is waiting in each step along its execution. Having such a granular data about each query execution helps to identify, more precisely, where the actual bottlenecks occurs during the query execution.
Based on this, it is evident that the ability of SQL Server to monitor wait statistics from a query execution (what query waits for and how long at each step of execution) is both a powerful and precise tool for determining the root causes of the slow query execution on SQL Server.
For a DBA that has to maintain SQL Server and address performance issues, every single wait event time for all executed queries has to be measured to isolate queries with the most significant impact on the SQL Server performance.
To create a proper system that is capable of monitoring SQL Server waits statistic, the following propositions must be meet:
- Every specific wait event that causes query to wait long has to be identified
- Queries or a set of queries, which cause performance issues, have to be identified. Therefore, SQL Server wait statistics, at a cumulative and individual query level is important for identifying performance issues and their root cause
- Each single event, between the query request and the query response, that causes the query to wait must be measured and logged
- Recollecting query wait statistics, for some period, to ensure insight into performance and historical trends of queries over time must be accomplished. This allows for the ability to separate “false positives” that may resemble, at first glance, actual performance problems.
SQL Server monitoring using wait statistics
In general, SQL Server wait statistic monitoring can be split into two different approaches. One is collecting cumulative wait statistics, and another is collecting all queries whose wait times are larger than a pre-determined duration defined by the user (collecting all queries could be counter-productive by requiring voluminous amounts of information to be stored). SQL Server dynamic management views (DMV) allow the user to get details about each request that are executed within SQL Server, and DMVs can be used in both approaches for performance monitoring.
Proper collecting of cumulative wait statistic considers that the user should be able to see what wait times are accumulated for wait types of interest and in a given period of time. The SQL Server Operating System or SQLOS enables continuous monitoring of SQL Server wait statistics and logs information that about why and on what query the system has to wait during execution. That means that using information collected by SQL Server itself can help locate and understand the cause of performance problems.
SQL Server wait statistics comprise the so-called “waits” and “queues”. SQLOS itself tracks “waits”, and “queues” are info on the resources a query must wait for. SQL Server utilizes over 900 different wait types, and every wait type indicates a different resource for which query waited for during its execution.
The sys.dm_os_wait_stats Dynamic Management View is where SQL Server logs the wait statistic data.
SELECT *
FROM sys.dm_os_wait_stats WHERE waiting_tasks_count > 0
ORDER BY wait_time_ms DESC
GO
While it is easy to get information about the wait types listed with the highest wait time using the above query, the data isn’t presented in a manner that is particularly useful when it comes to identifying the causes of performance issues.
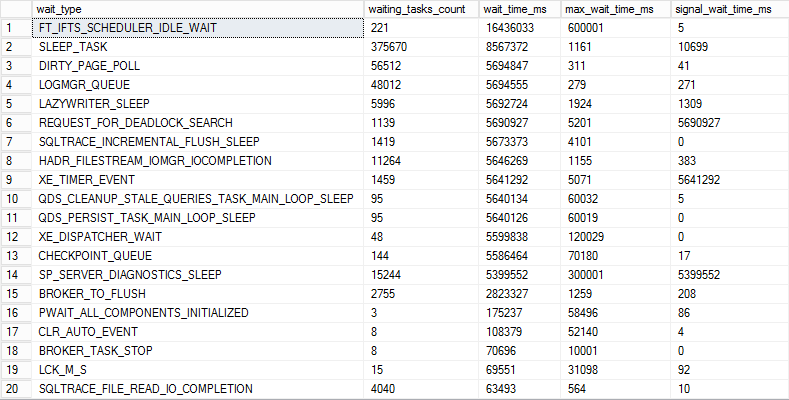
Data obtained by default tend to be too generic and doesn’t contain required additional details needed for troubleshooting, such as what wait time is accumulated in the specific time frame of interest and what wait types are present in that particular time frame. DMVs provide a list of wait types with the highest time accumulated since the last SQL Server startup, which can be several months or even longer. To get information sufficient for at least basic troubleshooting, collecting and storing wait statistic data periodically with deltas will do a better job at providing the necessary information.
Scheduling a query every 30 minutes, for example, and storing the data in a table allows going back into a specific period to identify a problem with acceptable precision. 30 minutes period is a good compromise between the amount of collected data and therefore storage resources and precision. Using shorter time intervals increases the accuracy at the expense of data storage while increasing the time reduces the precision and relax the need for storage space. So it is up to users to strike the appropriate balance and decide what suits their need the best.
Here is an example of how to set up our repository:
First, create the table should store the collected data.
CREATE TABLE [WaitStatsStorage](
  [WaitTypeName] [nvarchar](MAX) NOT NULL,
  [Value] [float] NOT NULL,
  [Time] [datetime] NOT NULL
)
GO
After that, the query that collects data should be executed periodically (30 minutes as suggested above).
INSERT INTO dbo.WaitStatsStorage  ([WaitTypeName], [Value], [Time] )
(SELECT wait_type , wait_time_ms, GETDATE()
FROM sys.dm_os_wait_stats
WHERE wait_time_ms > 0)
The WHERE wait_time_ms > 0 is used to prevent unnecessary collecting and storing wait types which wait time is 0.
The query can be scheduled using the SQL Agent or any other method available to the user.
Once the collecting of data is established, the following query can be used for reading the data.
declare @StartTime DateTime
declare @EndTime DateTime
SET @StartTime = '2017-10-02 02:00:00.000' -- Set the end time for the period of interest
SET @EndTime = '2017-10-02 02:30:00.000' -- Set the start time for the period of interest


;WITH ws AS (
SELECT [WaitTypeName], [Value],
 LAG  ([Value],1) OVER (PARTITION BY [WaitTypeName] ORDER BY [Time] DESC) -
[Value] AS val,
 [Time]
FROM dbo.WaitStatsStorage
--WHERE [WaitTypeName] IN (‘CXPACKET’,’PAGEIOLATCH_SH’, ‘ASYNC_NETWORK_IO’)
)

SELECT ws.[WaitTypeName], SUM(ws.val) as [WaitTime], MIN(Time) as [Start Time],
MAX(Time) as [End Time]
FROM ws
WHERE ws.val IS NOT NULL AND ws.val > 0
AND  @StartTime <= [Time] AND [Time] <= @EndTime
GROUP BY ws.WaitTypeName
ORDER BY [WaitTime] DESC
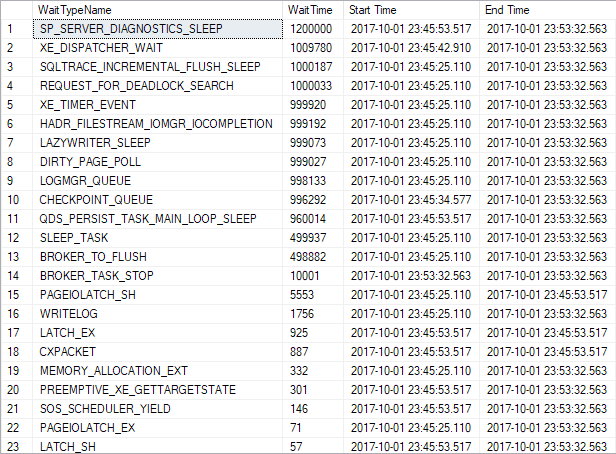
The yellow highlighted part of the query can be uncommented if there is a need to display only the results for the particular wait type or set of wait types to narrow down the results. The part in the query is just an example, and the user is free to customize to accommodate their own particular wait types instead.
Now that the method for collecting wait statistics has been established, the user can identify which wait types have accumulated the highest wait times, as those are potential candidates for further inspection. However, here it is important to note that not all wait types are a potential problem just because of a high wait time. Some typical examples are CXPACKET, SOS_SCHEDULER_YIELD, etc. For some wait types, a high wait time is normal and could indicate that SQL Server is, in fact, working optimally. Therefore, besides having that data, it is important to establish the method that prevents knee-jerk or superficial conclusions that can result in wasted time and effort investigating what is turns out to be a “false positive”.
The most reliable way is establishing the baseline for the collected wait statistics. Proper establishing of baselines for collected data and its presentation in an acceptable manner out of scope of this particular article but more on this topic can be found in the following articles: How to detect SQL Server performance issues using baselines – Part 1 – Introduction and How to detect SQL Server performance issues using baselines – Part 2 – Collecting metrics and reporting
SQL Server monitoring using query waits
Now that we have wait statistic data and we can identify the potentially problematic wait types with high wait times, the next step would be to identify queries executed contemporaneously, that contain the wait type that has to be inspected. To get the information about the currently running queries, use the sys.dm_exec_requests dynamic management view. Unfortunately, SQL Server uses this DMV to display details about queries that are active at the moment of reading data from the sys.dm_exec_requests DMV, and once the query completes execution, all related data to that query will be flushed. Therefore, it is necessary to establish the method for collecting and storing the queries and its data.
One way to get reasonably precise data is incrementally reading from the sys.dm_exec_requests DMV and collecting the data into the table designed to store collected query wait data. The more frequent reading from the DMV is, the better and more precise data will be collected. The maximum frequency of reading should not be higher than 1 second, but ultimately the frequency could depend on the required accuracy by the user. When the reading frequency is increased to 2, 5 10 or even more seconds, it is almost inevitable that some problematic or potentially problematic queries are going to be missed, as often it is not the wait time per query but high execution count for that query that generates the excessive wait time.
For collecting the query wait statistic, the following system can be established.
For storing the query waits data three tables must be created:
-
The table that temporarily stores the raw data obtained from the DMV.
CREATE TABLE [QueryWaitCurrentExecutionTemp] (
  [WaitTypeName] [nvarchar](MAX) NOT NULL,
  [WaitTime] [bigint] NOT NULL,
  [SPID] [int] NOT NULL,
  [SqlHandle] [binary](20) NOT NULL,
[StartTime] [datetime] NOT NULL,
)
GO
Since the reading frequency is quite high, the raw data obtained from the DMV that have to be processed first are stored in this table.
-
The table that temporarily stores the data after processing. This table is used to store the data collected during the query execution.
CREATE TABLE [QueryWaitCurrentExecution](
  [WaitTypeName] [nvarchar](MAX) NOT NULL,
  [WaitTime] [bigint] NOT NULL,
  [SPID] [int] NOT NULL,
  [SqlHandle] [binary](20) NOT NULL,
  [StartTime] [datetime] NOT NULL,
  [UpdateTime] [datetime] NOT NULL,

)
GO
The data related to specific query will be stored in this table as long as the query is running. Once the query execution is completed, the data will be moved in the table that stores the final data.
-
The table that stores the final data processed in a way suitable for presenting to the final user.
CREATE TABLE [QueryWaitStorage](
  [SqlHandle] [binary](20) NOT NULL,
  [WaitTypeName] [nvarchar](MAX) NOT NULL,
  [WaitTime] [bigint] NOT NULL,
  [StartTime] [datetime] NOT NULL,
  [SQLText] [nvarchar](MAX) NOT NULL,
)
GO
Once the query execution completes, the data for that session will be moved from the temporary table into this permanent table. That is the table used by end-users for reading the data.
Now that required tables are created, the query that reads the data from the DMV processes the raw data from the temporary table and stores into the table that holds the data while the query is active and finally that moves the data for completed queries into a permanent table. Schedule the below query to executes at one-second interval.
-- Delete data from temp table
DELETE FROM dbo.QueryWaitCurrentExecutionTemp

-- Get data for currently running queries
INSERT INTO dbo.QueryWaitCurrentExecutionTemp
 ([SPID], [SqlHandle], [WaitTypeName],[WaitTime], [StartTime])
 (SELECT
  sprc.spid as [SPID],
  sprc.sql_handle as [SqlHandle],
  RTRIM(sprc.lastwaittype) as [WaitTypeName],
  sprc.waittime as [WaitTime],
  req.start_time as [StartTime]
FROM master..sysprocesses AS sprc LEFT OUTER JOIN sys.dm_exec_requests req ON req.session_id = sprc.spid
  WHERE
( sprc.dbid <> 0 AND
  sprc.spid >= 51 AND
  sprc.spid <> @@SPID AND
  sprc.cmd  <>'AWAITING COMMAND' AND
  sprc.cmd NOT LIKE '%BACKUP%' AND
  sprc.cmd NOT LIKE '%RESTORE%' AND
  sprc.hostprocess > ''
  ))

-- Set current time
Declare @currentUpdateTime DateTime
SET @currentUpdateTime = (SELECT GETDATE() )


-- Merge Active queries
MERGE dbo.QueryWaitCurrentExecution  AS T
USING (SELECT [SPID], [SqlHandle],[WaitTypeName],[WaitTime], [StartTime] FROM
QueryWaitCurrentExecutionTemp) AS U
    ON U.[SqlHandle] = T.[SqlHandle] AND
     U.[SPID] = T.[SPID] AND
     U.[WaitTypeName] = T.[WaitTypeName] AND
     U.[StartTime] = T.[StartTime]
WHEN MATCHED THEN
    UPDATE SET T.[WaitTime] = U.[WaitTime]
WHEN NOT MATCHED THEN
    INSERT (  [SPID],   [SqlHandle],  [WaitTypeName],  [WaitTime],   [StartTime] , [UpdateTime])
    VALUES (U.[SPID], U.[SqlHandle],U.[WaitTypeName],U.[WaitTime], U.[StartTime] , @currentUpdateTime);


MERGE dbo.QueryWaitCurrentExecution  AS T
USING (SELECT [SPID], [SqlHandle], [StartTime] FROM QueryWaitCurrentExecutionTemp) AS U
    ON U.[SqlHandle] = T.[SqlHandle] AND
     U.[SPID] = T.[SPID] AND
     U.[StartTime] = T.[StartTime]
WHEN MATCHED THEN
    UPDATE SET T.[UpdateTime] = @currentUpdateTime;


-- Move data for completed queries from temporay table into a permanent table
INSERT INTO dbo.QueryWaitStorage  ([SqlHandle], [WaitTypeName], [WaitTime],
[StartTime], [SQLText] )
(SELECT [SqlHandle] , [WaitTypeName], [WaitTime], [StartTime], (select text from
sys.dm_exec_sql_text([SqlHandle]))
FROM QueryWaitCurrentExecution
WHERE [WaitTime] > 0 AND UpdateTime <> @currentUpdateTime)


DELETE FROM dbo.QueryWaitCurrentExecution
WHERE  [UpdateTime] <> @currentUpdateTime
Now that the Query waits collecting system is established, the needed data for the analysis can be retrieved. After the user identified, upon reviewing the collected wait stats results, that the specific wait type for example, SOS_SCHEDULER_YIELD is excessive, it can now can be further inspected by checking what queries executed in the same period when excessive wait type is identified.
Note that this query might not perform optimally and results could be incorrect for the queries that execute using parallelism. The parallelism problem could be resolved as well, but any potential resolution is beyond the scope of this article, so if used, the query must be accepted with this limitation.
Use the following query to read the necessary information.
declare @StartTime DateTime
declare @EndTime DateTime
SET @StartTime = '2017-10-02 02:00:00.000' -- Set the end time for the period of interest
SET @EndTime = '2017-10-02 02:30:00.000' -- Set the start time for the period of interest

SELECT * FROM
dbo.QueryWaitStorage
WHERE [WaitTypeName] = ' SOS_SCHEDULER_YIELD' – Replace with the name of the wait type to be displayed
 -- AND [WaitTime] > 4000 – Uncomment to display queries with wait type time
larger than specified here
AND @StartTime < [StartTime] AND [StartTime] < @EndTime
The query will display all queries that were waited for the SOS_SCHEDULER_YIELD wait type between the 2:00 and 2:30 in this particular example.

In this example, it is evident that some excessive wait times for SOS-SCHEDULER_YIELD wait type are associated with four queries executed in that period, and analyzing those queries to understand why it executes slowly is paramount.
We’ve accomplished a lot with our manual solution, but as it can be seen, using this approach to detect excessive wait types and then to drill down for queries that are the cause is quite complex, a potentially time-consuming and expensive effort.
Useful resources:
- sys.dm_os_wait_stats (Transact-SQL) | Microsoft Docs
- sys.dm_exec_requests (Transact-SQL)
- How to analyse SQL Server performance
- Introduction to Wait Statistics in SQL Server
- SQL Server wait types
October 6, 2017


