How to monitor SQL Server failover events automatically

Failover event overview

In general, the term “failover” refers to switching from a previously active machine, other hardware component, or network to a passive (or unused) one, to sustain high availability and reliability. In most cases, a failover event is an automatic process, while a the similar event, switchover, requires manual intervention in switching between the active/passive elements.

January 13, 2017

How to programmatically monitor system availability

System availability overview

Overall stability and availability of a machine in a specific time range is usually called system uptime. This measurement represents a period (sometimes percentage) when the system is stable and performing without unattended reboots, except for maintenance and administrative purposes, and works without issues. The opposite, system downtime is a period when machine is turned off (on purpose), or encounters experiences problems that result is the system being unavailable to users and processes. The combination of these two measurements is called system availability which is both identified and tracked with Windows Event Viewer (System Log).

December 23, 2016

The process of elimination: How to analyze SQL Server performance with baselines and wait statistics

https://s33162.pcdn.co/wp-content/uploads/2015/05/word-image49.png

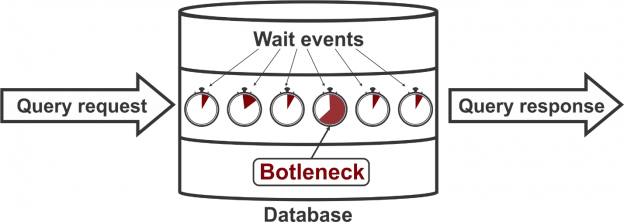
Wait statistics = Data

SQL Server’s built in abilities to track query execution via wait statistics is critical to resolving performance problems. Wait statistics or response time analysis are metrics that provide the ability to measure the time needed for the database to respond to executed queries. It doesn’t simply represent the time needed for a query to complete execution, but the wait statistic is also the measurement of the time the query has taken for each step in its execution. That information becomes the basis for identifying bottlenecks that are affecting the execution time.

December 20, 2016

Techniques to identify blocking queries and causes of SQL Server blocks

Blocked processes caused by locks on database objects are a common issue. Locking ensures the integrity of data stored within databases by forcing each executed SQL Server transaction to pass the ACID test. which considers that every transaction must meet the following requirements:

December 12, 2016

How to automate monitoring and alerting on SQL Server Agent status changes

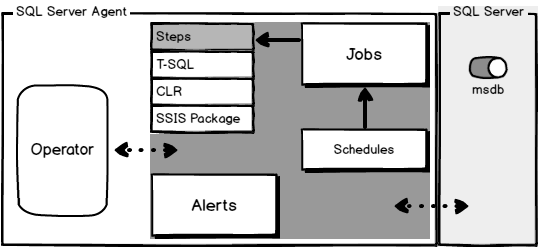
SQL Server Agent overview

The main purpose of SQL Server Agent is executing administrative tasks within SQL Server, mostly as on-demand user actions. It is Windows service which runs continuously in the background, but it stores necessary information within SQL Server itself, in the msdb system database.

December 6, 2016

How to get notifications on SQL Server performance issues

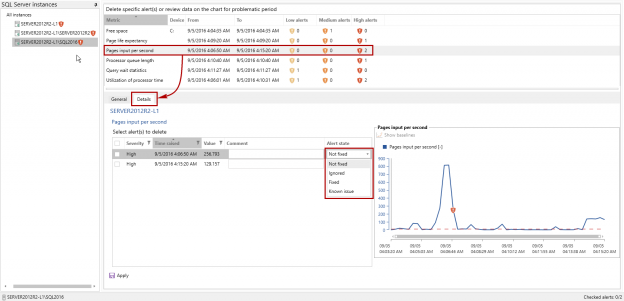
While Performance Monitor can be used for monitoring performance parameters of SQL Server, it doesn’t provide an option to get notifications when certain performance metrics values breach specified thresholds. The main reason why this is important is to be able to identify SQL Server performance issues as soon as possible, and react before they affect too many users. In addition, notifications on potential SQL Server performance issues could help avoid more serious problems by forecasting when they are likely to occur in order to avoid them. Therefore, one of the primary tasks for the database administrator is to establish a system that will ensure that he/she is going to be notified in case when certain performance metrics values are beyond the expected/desired range

September 8, 2016

Performance monitoring of AlwaysOn Availability Groups

The AlwaysOn Availability Group was introduced as a new feature in the SQL Server 2012 Enterprise edition and is designed to ensure a more advanced and reliable option for SQL Server high availability and disaster recovery.

May 19, 2016

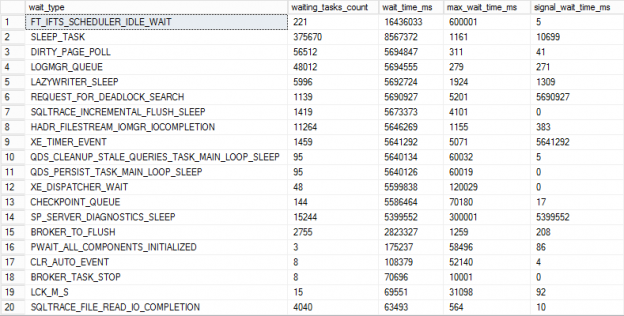
Troubleshooting SQL Server performance issues using wait statistics

The ability to successfully solve a problem and pinpoint the root cause of an issue that affects SQL Server performance depends on knowledge of the particular SQL Server system and environment, but also on personal experience which can help in determining where to start SQL Server performance troubleshooting.

May 20, 2015

How to detect SQL Server performance issues using baselines – Part 2 – Collecting metrics and reporting

To create a custom system for performance base lining we need the following:

  • A metric to track
  • A database and tables to store our collected data and processed information
  • A means to collect performance data
  • A means to process the performance data into meaningful information e.g. Mean, Standard deviation
  • A line chart of the data
  • A query to create a report of the measurements that exceeded the threshold, we set, for raising alerts
May 8, 2015

How to detect SQL Server performance issues using baselines – Part 1 – Introduction

In the following series of articles, we will discuss what baselines are, how they work and how to apply them to everyday SQL Server performance monitoring. This article will provide a brief overview of baselines and the statistical calculations behind them. Later we’ll apply this to real information gathering techniques to allow DBAs to create their own baseline.

May 4, 2015

Top SQL Server Memory Pressure Counters

Even a superficial reading of books and articles on SQL Server performance monitoring will tell you that SQL Server memory pressure is the first thing you should monitor. Not the only thing, far from it, and some CPU, I/O and internal SQL Server counters are critically important to get the complete picture but it’s the memory counters that often show us the first indication of suboptimal performance

March 3, 2015

SQL Server deadlock notifications

The existence of a deadlock may be indicated by application slowness, error messages or cases when a SELECT statement takes a long time to finish or terminates prematurely with the message:

Transaction (Process ID xx) was deadlocked on resources with another process and has been chosen as the deadlock victim. Rerun the transaction

All this indicates that SQL Server encountered a deadlock. A deadlock is a common issue with SQL Server. It is a circular blocking chain when two or more processes holding locks on data where each process wants to lock the data already locked by another process, and each process is waiting on the other process to complete before moving forward

March 2, 2015