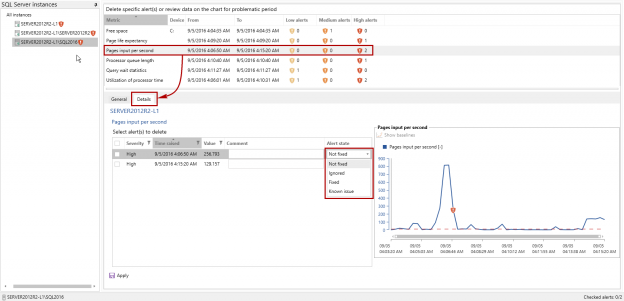
While Performance Monitor can be used for monitoring performance parameters of SQL Server, it doesn’t provide an option to get notifications when certain performance metrics values breach specified thresholds. The main reason why this is important is to be able to identify SQL Server performance issues as soon as possible, and react before they affect too many users. In addition, notifications on potential SQL Server performance issues could help avoid more serious problems by forecasting when they are likely to occur in order to avoid them. Therefore, one of the primary tasks for the database administrator is to establish a system that will ensure that he/she is going to be notified in case when certain performance metrics values are beyond the expected/desired range
September 8, 2016Performance monitoring of AlwaysOn Availability Groups
The AlwaysOn Availability Group was introduced as a new feature in the SQL Server 2012 Enterprise edition and is designed to ensure a more advanced and reliable option for SQL Server high availability and disaster recovery.
May 19, 2016Troubleshooting SQL Server performance issues using wait statistics
The ability to successfully solve a problem and pinpoint the root cause of an issue that affects SQL Server performance depends on knowledge of the particular SQL Server system and environment, but also on personal experience which can help in determining where to start SQL Server performance troubleshooting.
May 20, 2015How to detect SQL Server performance issues using baselines – Part 2 – Collecting metrics and reporting
To create a custom system for performance base lining we need the following:
- A metric to track
- A database and tables to store our collected data and processed information
- A means to collect performance data
- A means to process the performance data into meaningful information e.g. Mean, Standard deviation
- A line chart of the data
- A query to create a report of the measurements that exceeded the threshold, we set, for raising alerts
How to detect SQL Server performance issues using baselines – Part 1 – Introduction
In the following series of articles, we will discuss what baselines are, how they work and how to apply them to everyday SQL Server performance monitoring. This article will provide a brief overview of baselines and the statistical calculations behind them. Later we’ll apply this to real information gathering techniques to allow DBAs to create their own baseline.
May 4, 2015Top SQL Server Memory Pressure Counters
Even a superficial reading of books and articles on SQL Server performance monitoring will tell you that SQL Server memory pressure is the first thing you should monitor. Not the only thing, far from it, and some CPU, I/O and internal SQL Server counters are critically important to get the complete picture but it’s the memory counters that often show us the first indication of suboptimal performance
March 3, 2015SQL Server deadlock notifications
The existence of a deadlock may be indicated by application slowness, error messages or cases when a SELECT statement takes a long time to finish or terminates prematurely with the message:
“Transaction (Process ID xx) was deadlocked on resources with another process and has been chosen as the deadlock victim. Rerun the transaction”
All this indicates that SQL Server encountered a deadlock. A deadlock is a common issue with SQL Server. It is a circular blocking chain when two or more processes holding locks on data where each process wants to lock the data already locked by another process, and each process is waiting on the other process to complete before moving forward
March 2, 2015Monitor SQL Server queries – find poor performers – creating and analyzing SQL traces
In the previous part of this series, we showed how to use SQL Server profiler to create a SQL trace that provides enough information to find expensive SQL queries. In this part, we will show how to create a SQL trace without SQL Profiler and how to analyze the information captured.
October 6, 2014Monitor SQL Server queries – find poor performers – SQL Server Profiler
In the previous parts of this series, we described how to find the most expensive recent queries using SQL Server Management Studio native features and dynamic management views and functions. In this part, we will show how to do that using SQL Server Profiler.
October 1, 2014Monitor SQL Server queries – find poor performers – dynamic management views and functions
In the previous part of this series, we described why tracking most expensive queries is important and how to use SQL Server Management Studio native solutions. In this part, we will focus on dynamic management views and functions.
September 30, 2014Monitor SQL Server queries – find poor performers – SSMS Activity Monitor and Data Collection
Monitoring and diagnosing SQL Server performance requires monitoring performance metric values, but also understanding these metrics and their relation to other metrics, knowing metric normal values, monitoring resource-intensive processes and queries, etc.
September 16, 2014Operating System (OS) performance monitoring
Efficient SQL Server performance monitoring includes monitoring of operating system, SQL Server, and database performance. In How to monitor your SQL Server instances and databases, we presented tools for monitoring the latter two performance metrics, In this article, we will present tools that provide operating system performance monitoring.
July 16, 2014How to be proactively alerted of SQL Server performance problems
When it comes to monitoring SQL Server performance, there are a few native SQL Server solutions that provide out of the box performance monitoring. We have written about some of them here: A DBA guide to SQL Server performance troubleshooting – Part 2 – Monitoring utilities.
June 27, 2014How to monitor your SQL Server instances and databases
Monitoring SQL Server instances and databases provide information necessary to diagnose and troubleshoot SQL Server performance issues, as well as to fine-tune SQL Server. Optimal performance is not easy to define and set, as there is usually a trade-off between multiple software and hardware factors. It also depends on your environment, business requirements, and company policy.
May 26, 2014Using SQL Server database snapshots to protect yourself against accidental data modification
Introduction
How often have you wished you could just quickly undo a DML statement without having to go through the lengthy process of restoring your database backup?
October 22, 2013How to synchronize large SQL Server databases
When synchronizing large databases that contain millions of records, you will come across several challenges The first challenge is to just compare such databases. When the database tables contain millions of records, their comparison through the ApexSQL Data Diff graphical interface will be very slow and in such cases, it is strongly recommend using the ApexSQL Data Diff command line interface. As there’s no need to show millions of records visually in the tool’s grid, such large databases are processed faster.
April 29, 2013Improve the performance of an ETL process
Due to the sheer volume of data usually involved in an Extract – Transform – Load (ETL) process, performance is positioned very high on the list of requirements which need to be met in order for the process to go as smoothly as possible. Here are some guidelines which will help you speed up your high volume ETL processes
April 23, 2013Use SQL database backups to reduce the performance impact of heavy reporting
Depending on your particular environment, database reporting can have a heavy impact on the database performance, can execute queries which run for dozens of minutes or both. This is usually the case with reports which require complex queries having multiple calls to SQL Server’s aggregate functions to be executed against very large data sets. The effect on the database performance is particularly severe in scenarios where the production database stores data which is changed often – as data modification operations require exclusive locks, in order to preserve the integrity of the database, SQL Server will go ahead with the data modification operation until the query initiated by the report is still running. This increases the chances of a deadlock occurring; especially in cases where another set of data modification instructions, dependent on the ones which are waiting for the reporting to finish has already been applied. Therefore, reporting can cause performance degradation in a production environment. So, how can reporting be optimized to prevent such a heavy load on production databases?
April 4, 2013Improve the performance of your SQL queries by qualifying object names
In addition to replacing the * wildcard in SELECT statements with an explicit list of column names, fully qualifying all SQL object’s names in SQL queries will boost their performance.
April 4, 2013