


Performance is a big deal. No matter if we’re talking about applications in which users click buttons to display data or if we’re writing a query directly into let’s say SQL Server Management Studio (SSMS). Nobody likes to click a button, go get a coffee, and hope the results are ready. As computers get faster and technology moves forward users get more impatient and want things right now; without having to wait.
The SQL Select statement is the primary mechanism to retrieve data from a database. Often even clicking a single button requires query performance optimization because everything that’s actually happening under the hood is just SQL Server pulling the data from a database. In the database world, this is very important. Therefore, we need to make sure that our queries are performing well. This is something that we can design with a focus on query performance, but we can also find and troubleshoot slow performance queries by identifying bottlenecks in them. Let’s face it, querying data is not just writing Select (*). There is more to it than that.
Hopefully, this article will help you if you ever find yourself in a situation when a user gives you a call at 4:30 PM on Friday and says, “this application is too slow” or you just want to test and optimize your queries.
Query optimization overview
A query execution/explain plan AKA execution plan is an ordered set of steps used to access data in a SQL Server. It’s basically a map that SQL Server is drawing to the shortest ideally the most efficient path to the data in our database. Such a plan is created when a query is accepted by SQL Server and it’s coming from either an application or it’s coming from us when testing query performance.
SQL Server’s query optimizer does an excellent job by generating a physical model of the most efficient route to the data. If you’re a network guy like me, look at it as the number of hops for packets through a network which data must pass between source and destination. It shows how a query will be or was executed. You might be wondering why we need to know all this internal stuff and the simple answer is that it gives us an insight into what’s happening under the hood. More specifically, it tells us what part of a query costs the most CPU time, reads/writes time AKA I/O and gives us the opportunity to fix slow performance queries and to improve those times because, in the real world, we often need to manually examine and tune the execution plans produced by the optimizer to get even better performance.
Furthermore, these plans display helpful graphical information that shows how SQL Server is accessing data; if it’s doing a full table scan vs full index scan vs index seek. This can be a helpful performance optimization as index scans are generally performance-intensive because they’re scanning the entire index. Full table scans are similar because they’re scanning every single row in a table.
Statistics are an important part of the entire process as they help the query optimizer to make the best guesses when accessing data. These statistics include information about columns like: estimated number of rows, the density of pages on disk, available indexes to use, etc. that the query optimizer uses to generate query plans. It’s essential to keep these statistics up-to-date as the query optimizer will use them to enforce query plans. But this is something that SQL Server does automatically and it also does an excellent job with default settings too, so you don’t have to worry about this except to know that it’s an important aspect.
So, all of this is internal stuff and we already mentioned that SQL Server does an excellent job at managing the statistics and creating execution plans but it can only do as good of a job as the queries we’re passing to it. This is the main reason why many performance issues are directly connected to poorly designed queries. Developers often have a tendency to just write queries because we’re against the clock most of the time. Do we think about performance? Not always or as much as we should. If the query does what it supposed to, great! We can tune it later. And this is okay sometimes. You might have a new database and your queries are performing well, but a month down the road when the data has started flooding the database, all of a sudden, things start to slow down.
Working with query plans
So, let’s move on to query plans. For the purpose of this article, we are going to use a tool from ApexSQL software called ApexSQL Plan. This application is a SQL query analysis and optimization tool. It identifies performance issues and deadlocks, analyzes stored procedures, SQL Server query issues, query execution plans, and helps you understand query performance characteristics.
We already mentioned a few performance guidelines, so let’s dig in and show some examples and at the end of this article we’re going to wrap thing up with a conclusion about best practices.
If you’re not familiar with SSMS’s native execution plan, there’re basically two options here:
- Estimated execution plan – As the name applies, this option generates graphical estimated execution plans without the Transact-SQL queries or batches being executed against the targeted database. This plan does not contain any runtime information, actual resource usage metrics or runtime warnings.
- Actual execution plan – This option generates plans after the T-SQL queries or batches are executed. These plans include runtime information such as actual resource usage metrics and runtime warnings.
The general rule of thumb is always to go after the actual execution plan. Why? Well, simply because it provides actual numbers not some estimated based on statistics, etc. The only reason you wouldn’t use the actual execution plan is if you’re in a production environment.
Full table scan
If you remember from the overview, full table scans are performance intensive because they scan the entire table, row-by-row and because of that they should be avoided. To give you an example of this, we need a brand new table that has no indexes or you could check your database for existing tables without indexes by running the query from below:
USE AdventureWorks2014;
GO
SELECT DISTINCT
       [TABLE] = OBJECT_NAME(OBJECT_ID)
FROM SYS.INDEXES
WHERE INDEX_ID = 0
      AND OBJECTPROPERTY(OBJECT_ID, 'IsUserTable') = 1
ORDER BY [TABLE];
GO
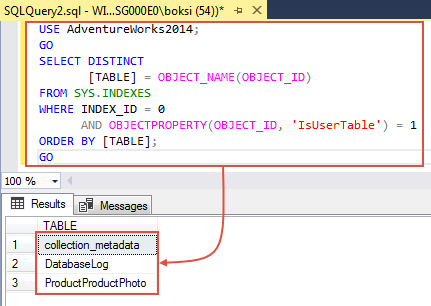
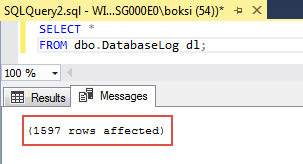
The query returns names of the tables from the database specified in the Use statement that have no indexes at all. If we run a quick Select (*) everything from one of those tables, we should get the data and, as you can see, in this example 1597 rows were effected:
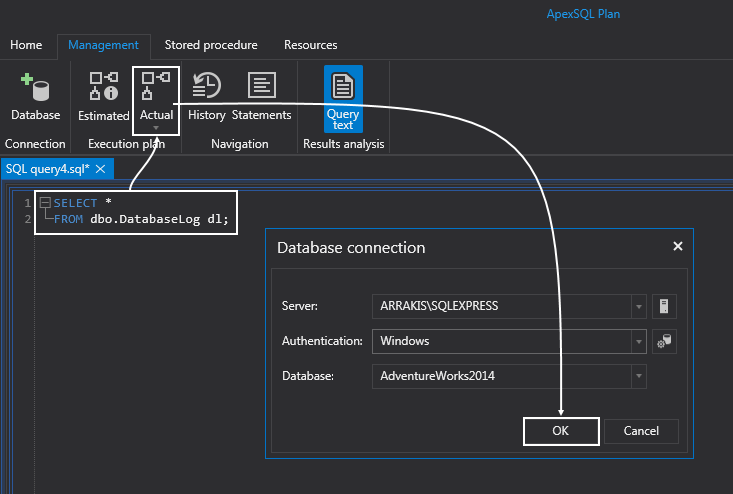
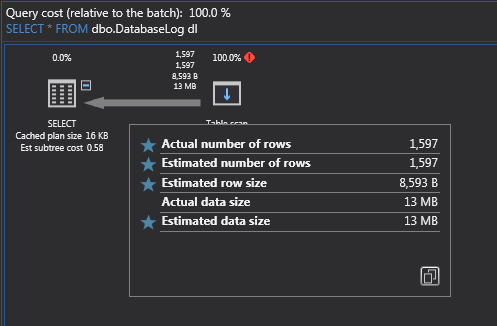
If we switch over to ApexSQL Plan, we can paste the same query in the Query text editor, click the Actual button under the Execution plan group to see what’s happening under the hood. You will be prompted to connect to appropriate database, so verify this and click the OK button to display the actual execution plan:
Because this table has no indexes on it, SQL Server will perform a full table scan which is not the ideal outcome. Remember that we should avoid full table scans, if at all possible, and the best way to avoid them is to put an index on your table; a clustered index to start with and then obviously a non-clustered index for other queries that maybe hitting specific columns in your table:
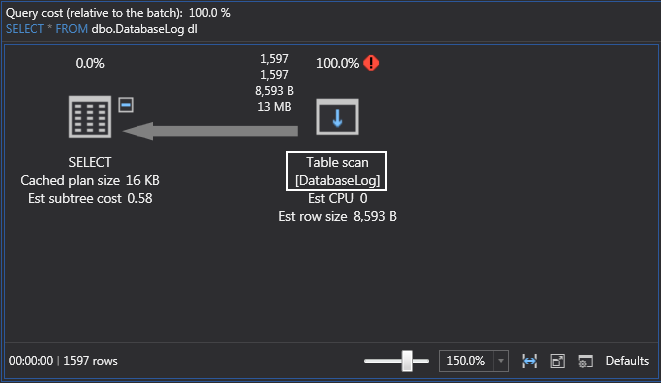
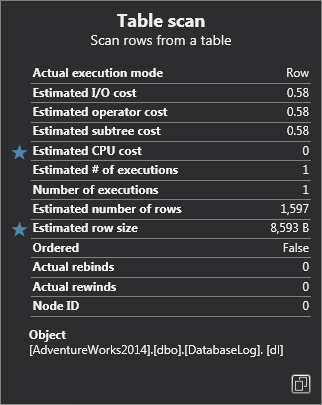
A few words about the designer… If you hold the mouse over the table scan icon, it will bring up a tooltip that gives us a lot of specific information about this specific task; from the type of operation to the number of rows, estimated I/O cost, etc.:
If you hold the mouse over the line (arrow), it will bring up another type of tooltip that gives you the number of rows that it returns. In cases when we have many tables, this line gives us an overview of the data flow structure. Also, note that the thickness is the visual indicator of how many rows returned:
Know that full table scans are generally bad for performance, especially when you have complex queries, but also keep in mind that sometimes even small queries with indexes will still precipitate a table scan. Why? Because SQL Server estimates that it’s more efficient this way and usually in cases with the lower number of rows in a table. So if you see sometimes a table scan on a small table, don’t be alarmed.
Cluster index scan
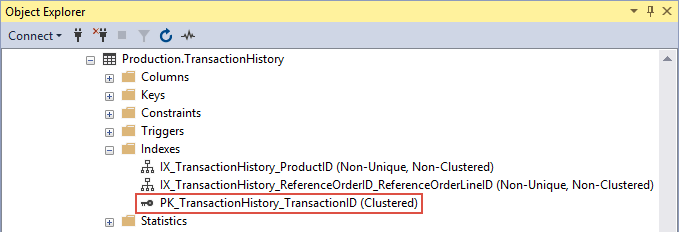
The clustered index scan is an operation which is not much different than a table scan. To show you an example, there is a table inside the ’AdventureWorks2014’ database called ’Production.TransactionHistory’. If we navigate to it in Object Explorer, under the Indexes folder there should be the ‘PK_TransactionHistory_TransactionID’ clustered index which is also a primary key:
Let’s jump over to ApexSQL Plan and run another query to see the execution plan. Execute the query from below:
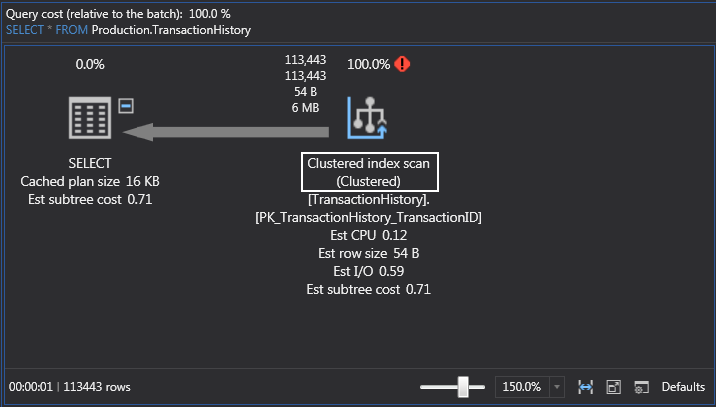
SELECT *
FROM Production.TransactionHistory;
This time, SQL Server is doing a clustered index scan which is still scanning the data and the pages row-by-row only this time it’s scanning the index itself because with the clustered index the data is stored within the index:
The general rule is that the scans are bad, seeks are good. So, what this means, is that we need a Where clause.
Cluster index seek
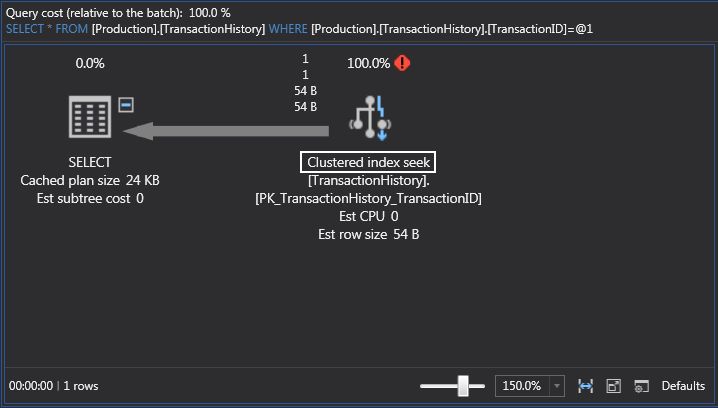
So, let’s add a Where clause on the ’TransactionID’ table and see what this action will change. Execute the query from below:
SELECT *
FROM Production.TransactionHistory
WHERE Production.TransactionHistory.TransactionID = '100116';
Now we have a clustered index seek which is much better because the query is just requesting a specific number of rows:
Another interesting thing to know here is what SQL Server did with the ’TransactionID’ value. It parameterized the value. These are also known as parameterized queries. SQL Server and query optimizer do this automatically for us and the reason they do it is to reuse this query plan:
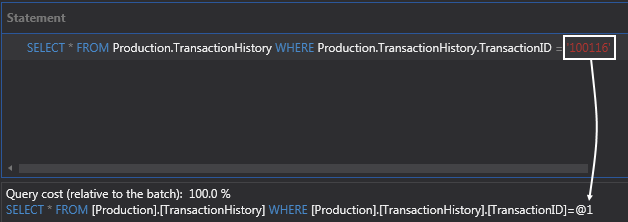
For example, we could create another query from another application that has the same structure (does the same thing) and SQL Server and query optimizer will use this execution plan again because it is parameterized which means that the query plan is really the same it’s just the value that will change. So that’s why it creates a variable and turns it into a parameter for us. Because of this, parameterized queries are way better.
Index seek (Non-Clustered)
This is the most popular one. These indexes are created to “cover” the queries. What I mean by cover is that they are being used in a Where clause, to cover the data that is being pulled out. Because if we cover it with an index that means the query will most likely use the index which will ultimately give us huge query performance boost.
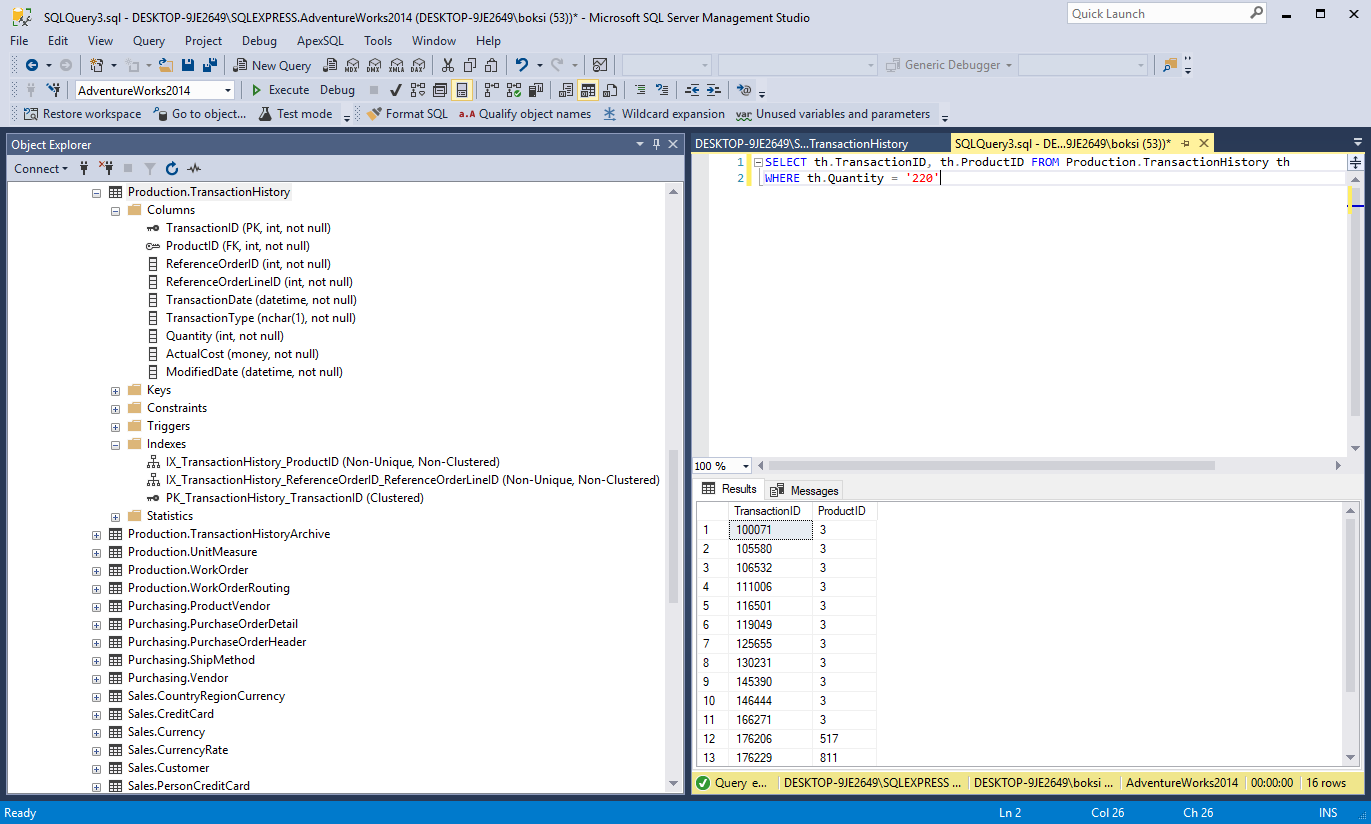
So, let’s see this in action and create an index on the ‘Quantity’ table. But fist of all, execute the query from below and navigate to the ‘TransactionHistory’ table in Object Explorer to check the current indexes:
SELECT th.TransactionID, th.ProductID FROM Production.TransactionHistory th
WHERE th.Quantity = '220'
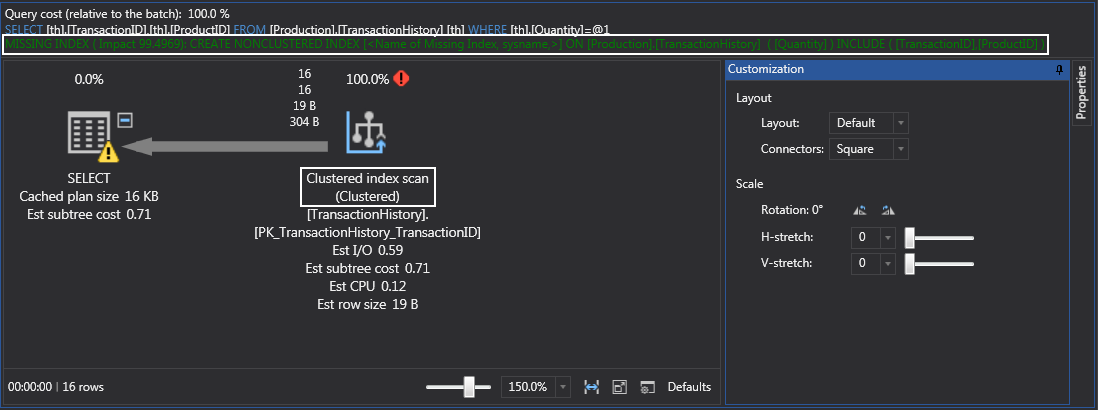
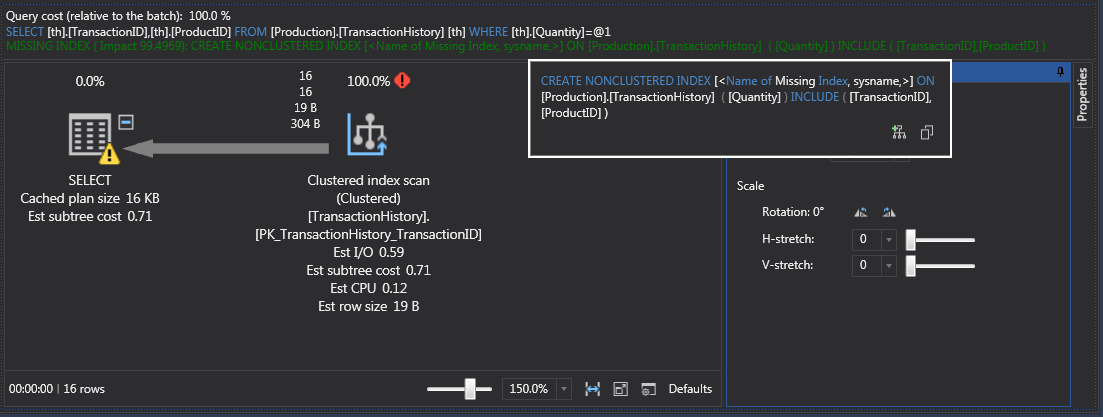
Let’s also look at the execution plan. If we run this query we’ll get clustered index scan because that’s what on the table. Note that ApexSQL Plan will also throw a message about missing index right below the query:
We can create the index on the ‘Quantity’ table manually but we can also position the cursor over the missing index text and the tooltip will appear. From there, we can use the icon on the bottom-right to invoke index creation dialogue:
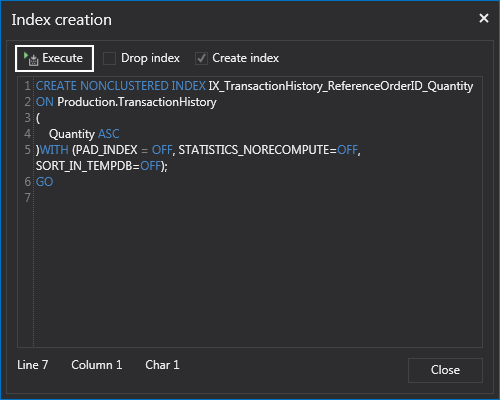
Execute the query from below to create missing index:
CREATE NONCLUSTERED INDEX IX_TransactionHistory_ReferenceOrderID_Quantity
ON Production.TransactionHistory
(
    Quantity ASC
)WITH (PAD_INDEX = OFF, STATISTICS_NORECOMPUTE=OFF, SORT_IN_TEMPDB=OFF);
GO
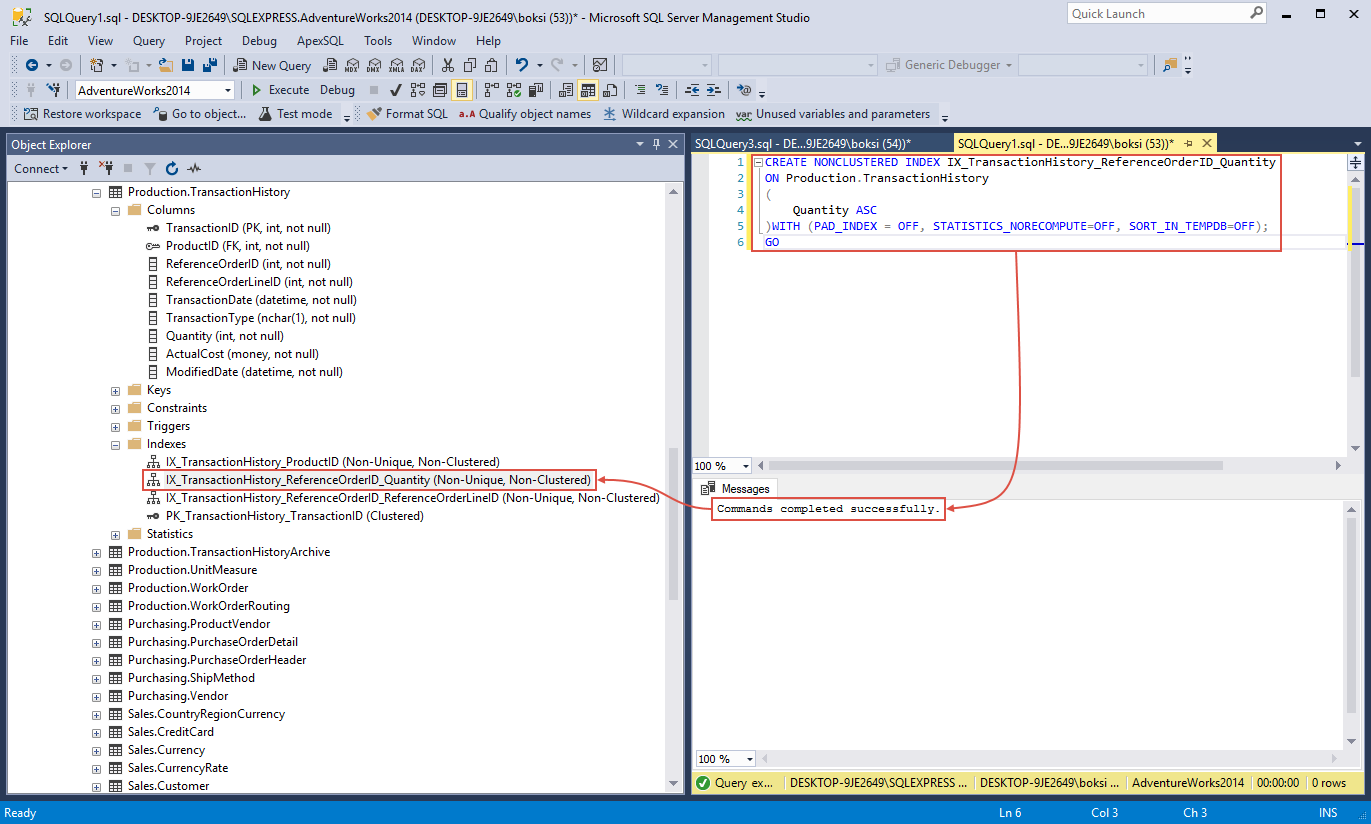
If we refresh the Indexes folder in Object Explorer, we’ll see our newly created ‘IX_TransactionHistory_ReferenceOrderID_Quantity’ index:
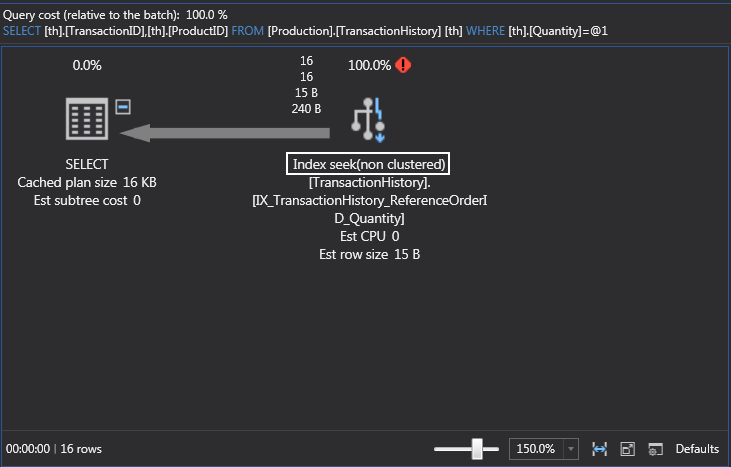
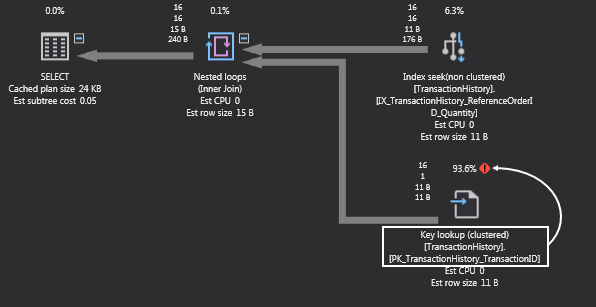
Now if we run this to get the actual execution plan, we’ll see that it’s performing a non-clustered index seek which is great for performance. This also means that the index is used by our query:
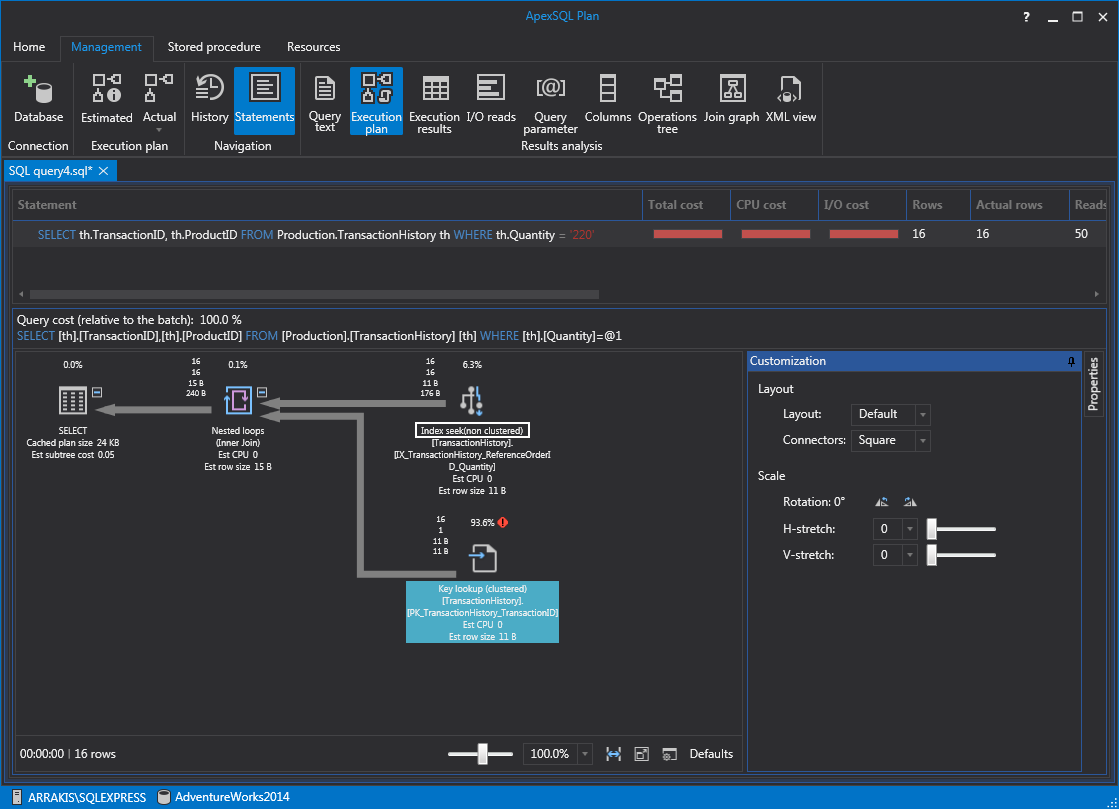
Now, some might say “we fixed one thing, but created an additional key lookup and a nested loop. That can’t be good”. Well, that’s not the point. This is going to happen now and then and that’s okay. The remarkable thing about Execution plans is that we can analyze things and fix them, iteratively, to improve query performance.
Optimizing query performance
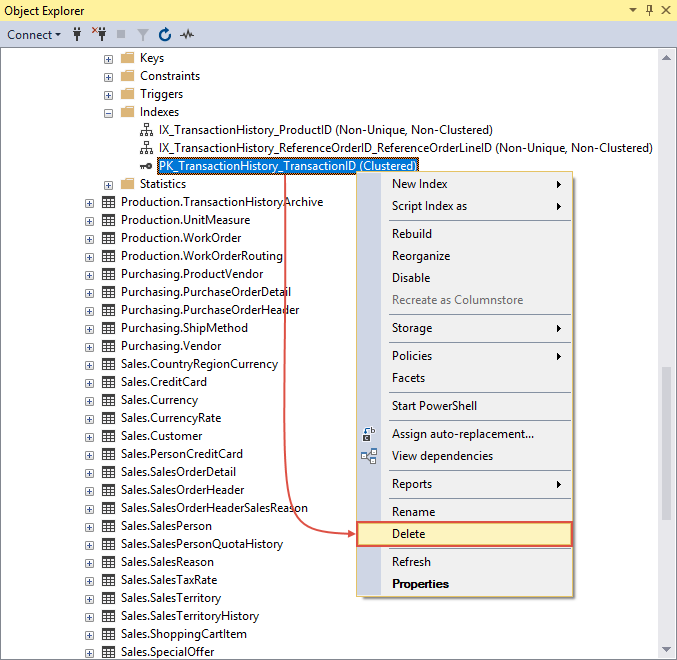
To continue with the example from above, let’s analyze the plan and see what we can do about it. It’s obvious that the clustered key lookup on the ‘PK_TransactionHistory_TransactionID’ index is taking the most resources (93.6%):

What we can do is to delete it by right clicking it and choosing the Delete command:
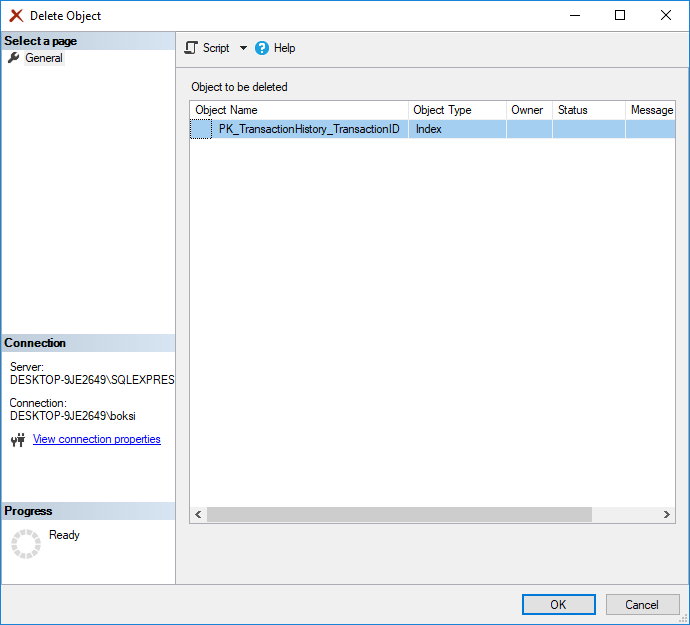
This action will open additional dialog in which the user only needs to click the OK button to confirm the deletion:
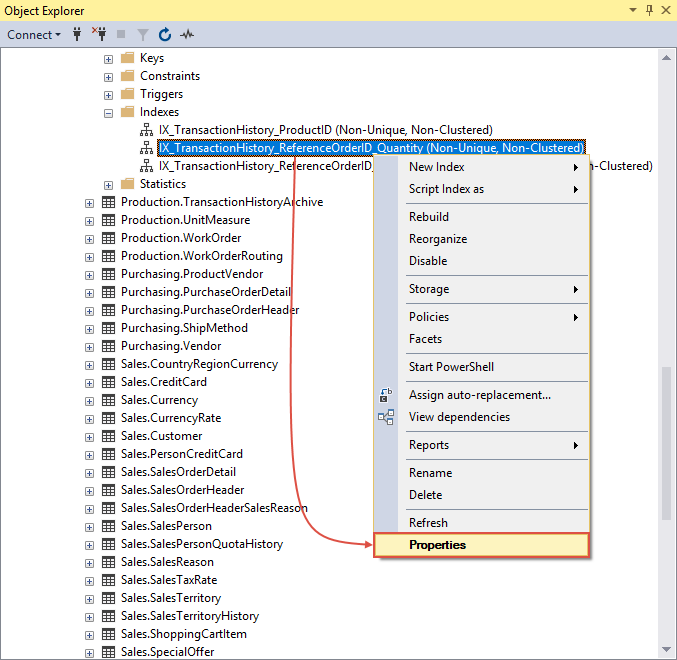
Now, let’s take a look at included columns options that comes very handy in a situation like this. Go back to Object Explorer, right-click or double-click the ‘IX_TransactionHistory_ReferenceOrderID_Quantity’ index to bring up the context menu and choose the Properties command:
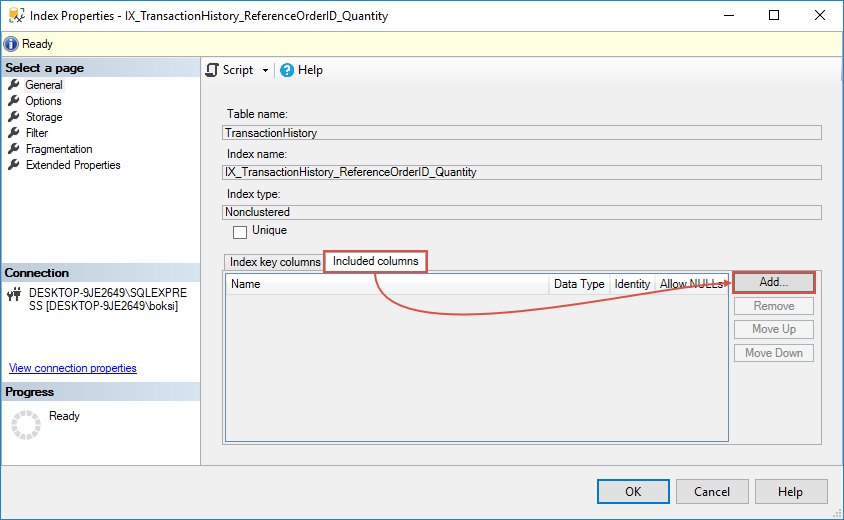
Next, you’ll see an Index Properties window. Switch the ‘Index key columns’ tab on the bottom-right to the ‘Included columns’ tab and click the Add button to the right:
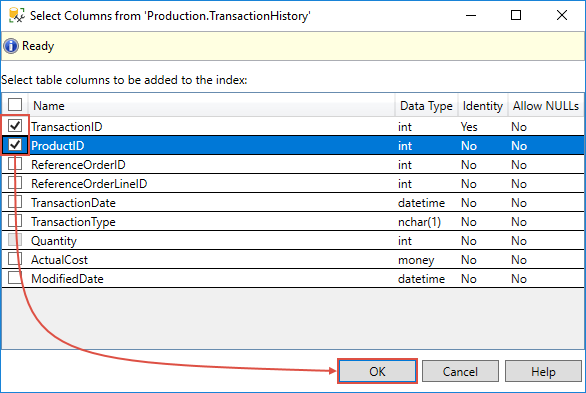
In the next window, we can select table columns to be added to the index. In this case, two columns from ‘Production.TransactionHistory ‘are used in the Select statement, so we need to check both ‘TransactionID’ and ‘ProductID’ table from the list and click the OK button:
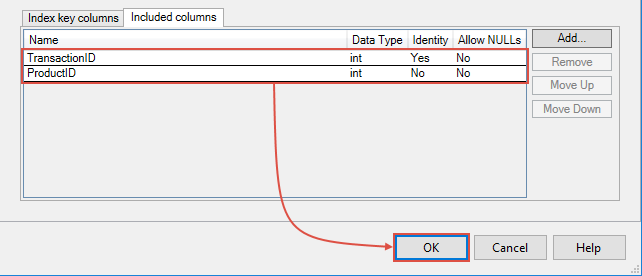
Back to the previous window, now that the two columns are listed under the Included columns tab, click the OK button to continue:
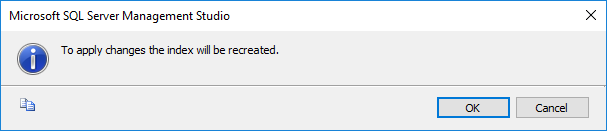
A confirmation dialog pops-up informing us that the index will be recreated. Hit the OK button once again and we just successfully finished editing index’s properties:
Now if we come back and run the same query again, we eliminated both the key lookup and nested loops and we now have just the index seek.
I actually want to revert the changes and go back to the state when we just added the index and switched the execution plan operation from a clustered index scan to a non-clustered index seek which also created the additional key lookup and nested loop. Why? Because you’ll see this many times e.g. when selecting additional columns and to give you a better understanding why this is happening.
If we take another look at the execution plan, note that the index seek is doing a decent job, but the key lookup is eating all the resources. This will happen in a case when we add one or more columns in the Select statement and we’re searching for a product ID that doesn’t exist. SQL Server is doing the index seek, but it also does a key lookup and that’s because we have a clustered index and it’s looking for the data inside the clustered index. Key lookups AKA bookmark lookups can be bad for performance because they use a bookmark (row ID or clustering key) to look up the corresponding row in the table or clustered index. In this case, the ‘PK_TransactionHistory_TransactionID’ isn’t in any sort of index and it must get the data which is stored in the clustered index:
We already fixed this query, but in my humble opinion, it’s also important to know the cause and how to fix it by telling the SQL Server to pull the data from exactly where it is without scanning the entire clustered index.
The bottom line is to get familiar with query plans and know-how to decipher them which will ultimately help you find the bottlenecks of slow performance queries. The single most important thing we can do is to have a good index strategy and when I say a good strategy, I mean understanding not only your data but also what kind of queries are hitting your data. The purpose of this article was to explain how to improve query performance in general and this is only a piece about indexes, but I would highly recommend checking other write-ups about these topics that will help you gain an even better understanding:
- How to identify and solve SQL Server index scan problems
- SQL query performance tuning with I/O statistics and execution plans
- How to analyze query performance characteristics in SQL Server
Best practices
- The more filters in the Where clause the better. Simply because the more filters we put in is less data that SQL Server will return. You’ve seen this in this article, but keep in mind when you see scans; you either don’t have a Where clause or the Where clause didn’t cover enough columns
- Select only columns that you need. Too often people have a complex query with a lot of Where clauses and Joins, but if the query starts with the Select (*) everything which directly affects the network, bandwidth, and SQL Server because it’s grabbing everything instead of only fetching columns that you need
- Be mindful of Joins. This is entirely another aspect of the game. SQL Server internally has three different ways to tie data from multiple tables together. Covering all of them would require another article which I have in mind for the future. The general rule here, always join columns that have indexes, keys on them and stay away from joining columns like character data
- Revisit indexing often. We already mentioned this when talking about the indexing strategy. There is one tool, part of SQL Server, that’s called Index Tuning Wizard which I wanted to mention which can be quiet useful, but I’ll make sure to cover this in one of the next articles
- Create indexes on boolean and numeric data types. Basically, we’re looking for data with a high value of uniqueness which are great candidates for indexes
- Ensure indexes cover Where clauses. Also shown in this article with switching execution plan operation from clustered index scan to non-clustered index seek
- Move queries to stored procedures when possible because you can get a reliable performance gain from doing so
Hopefully, I covered some good tips, tricks, and guidelines on how to be proactive when designing your queries with performance in mind.
Useful links
- Identify Bottlenecks
- Displaying Graphical Execution Plans (SQL Server Management Studio)
- Checklist for Analyzing Slow-Running Queries
January 23, 2018


