


There are several ways (techniques) of monitoring query performance and finding slow queries such as System Dynamic Management Views, SQL Server Profiler, SQL Server Extended Events.
Recent to the scene, are a couple of features (tools) have appeared that make monitoring of query performance make easier than it used to be.
In this article, we will discuss the Microsoft SQL Server Query Store (Query Store) feature, then about William Durkin and Enrico van de Laar OpenQueryStore (Open Query Store) feature and, in the end, the Query store feature will be introduced from ApexSQL Plan, a tool for visualizing and viewing SQL Server query execution plans, analyzing and Identifying query performance issues and more.
Here are common scenarios where these features can be useful:
- Easily find and fix performance problems by forcing the previously query plan which performances are better than a newly generated plan
- Identify the top n most expensive queries for I/O, Memory, CPU etc.
- Show the number of times that queries have been executed in the specific time frame
- Review the full history of query executions
SQL Server Query Store (Query Store)
This feature was introduced in SQL Server 2016 CTP2. SQL Server Query Store is available for any SQL Server editions and can be separately enabled for every SQL database using T-SQL code or SQL Server Management Studio (SSMS). On Azure databases, by default the Query Store is enabled.
SQL Server Query Store, in easy and quick way, shows results in built-in reports.
To use Query Store the VIEW DATABASE STATE permission is needed. To data flush Interval, force execution plan, etc., the db_owner fixed database role is required.
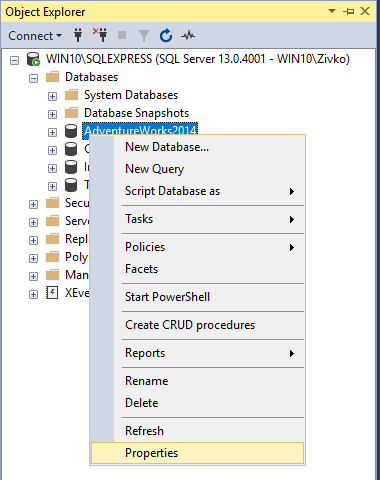
To start monitoring query execution on SQL database using the Microsoft Query Store feature, establish connection with SQL Server on which is located desired SQL database. In the Object Explorer, select the SQL database, right click, in the context menu, click the Properties command:
In the Select a page of the Database Properties dialog, choose the Query Store:
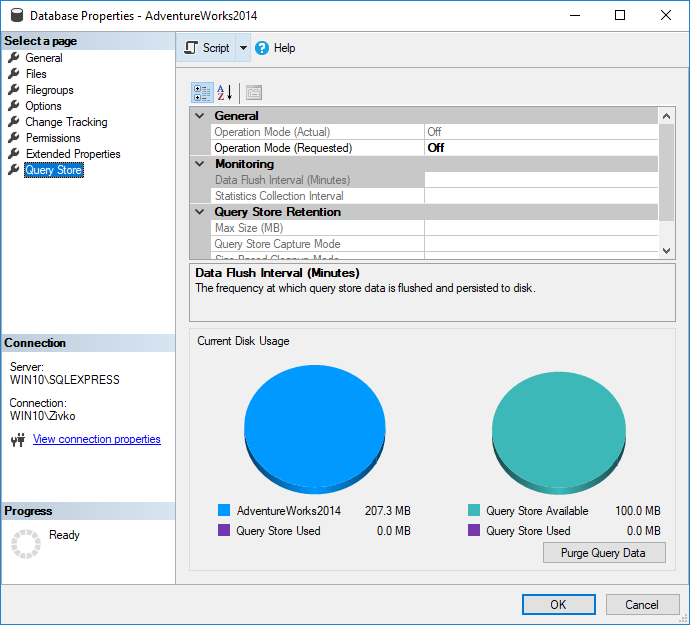
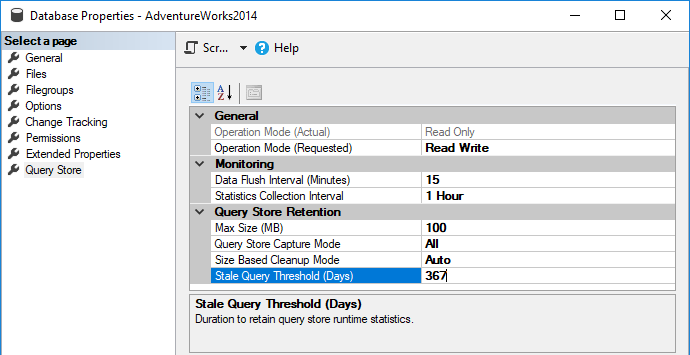
To enable Query Store in the General section under the Operation Mode (Requested) dropdown box, select the Read Write value:

As soon as the Read Write value form the Operation Mode (Requested) dropdown box is chosen the fields under the General, Monitoring and Query Store Retention section will be pre-populated with default values:
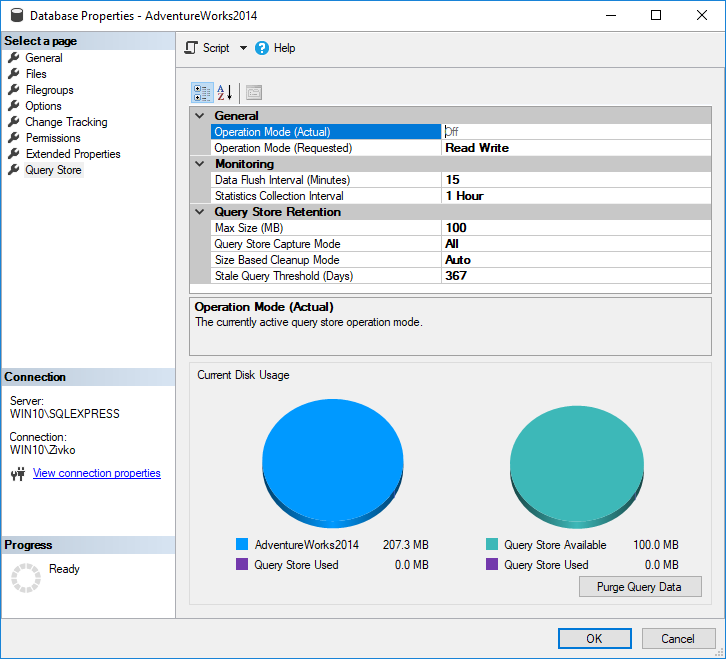
General section
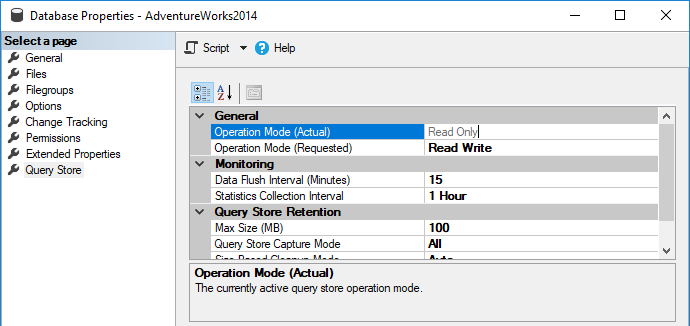
Operation Mode (Actual) determines the state of Query Store and the values in this box cannot be modified. There are three states Off, Read Only and Read Write.
The Off state indicates that the Query Store is turned off. The Read Only value indicates that the new query execution plans or query runtime statistics will not be collected. The Read Write values indicates that the new query execution plans or query runtime statistics will be collected (tracked).
Operation Mode (Requested) has the same options as Operation Mode (Actual), but, here, the chosen value from the dropdown box will have direct impact on the state of SQL Server Query Store:

Monitoring section
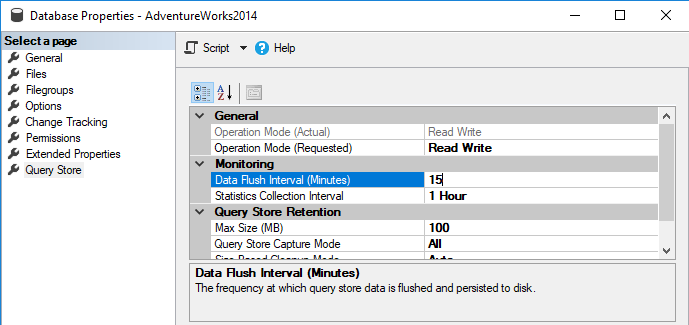
Data Flush Interval (Minutes), this option by default is set to 15 minutes. This is the period that will be passed before the query execution plans and the query runtime statistics plans will be pulled from memory to SQL Server instance disk. A lower value means that flashes data from memory to SQL Server instance will often occur and may cause a lower performance of SQL Server instance but in case that a higher value is set, more information will be stored in memory before it flushed to SQL Server instance disk which increases the risk of losing data if SQL Server restarts/crashes:
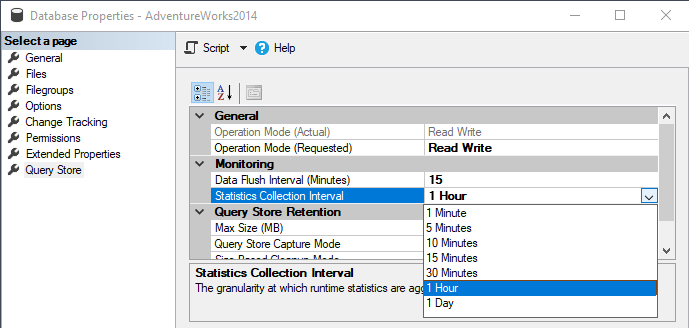
The Statistics Collection Interval defines the granularity at which runtime statistics are aggregated. This value by default is set to 1 hour. A lower value in this option means that granularity will be better (finer), but this also means that more disk spaces are required for saving query runtime statistics:
Query Store Retention section
Max Size (MB) can set the max size of the SQL Server Query Store. This option by default is set to 100MB. The Query Store collects the data in the database for which is enabled. The storage size of the Query Store does not auto grow and when the maximum size of the Query Store is reached, the Operation Mode (Actual) will go automatically to the Read Only mode and the new query execution plans and the query runtime statistics will not be collected:
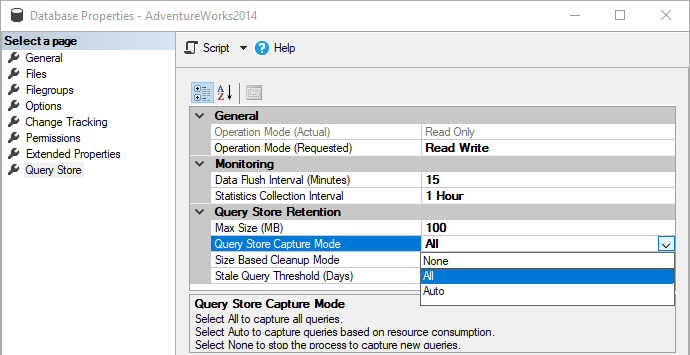
Query Store Capture Mode – using this option, which queries will be tracked can be configured. There are three values that can be set for this option.
- The value All is set by default. When this option is set, all executed queries that run on the database on which the Query Store is enabled will be tracked.
- In case when the Auto value is set, then the Query Store will capture queries based on resources consumption and the ad hoc or infrequently executed queries will be ignored.
- If the None value is set, then the Query Store will stop collecting information for new queries and continue collecting information for queries that were previously recorded:
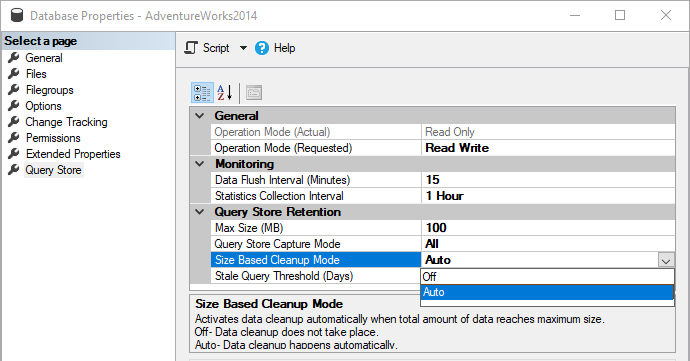
Size Based Cleanup Mode, this option activates the cleanup process when total amount of data reaches up to 90% of capacity set in the Max Size (MB) filed. This process deletes the less expensive and the oldest query data. The cleaning will stop when 80% of the max size is reached. This option by default is set to Auto. When the Off value is chosen, then the cleaning process will not be activated and the Query Store will be go to the Read Only mode, when the max size is achieved:
Stale Query Threshold (Days) in this field the number of days can be set to show how long the query store runtime statistics will retain. It is set by default to 30 days:
When all options are set, press the OK button on the Database Properties dialog to enable the Query Store to start capturing query execution plans and runtime information.
To verify that the SQL Server Query Stored is enabled, go to Object Explorer, refresh and expand the database on which is enabled the Query Store and find the Query Store folder:
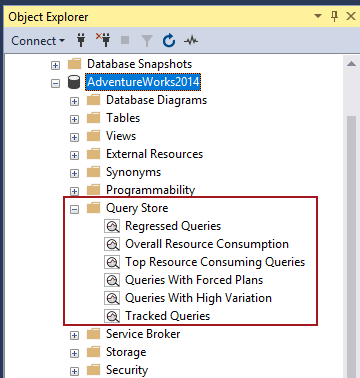
The built-in reports under the Query Store folder will gather all query execution plans and runtime statistics data, analyze them and show that data in the chart or grid format depending on what is set in the reports.
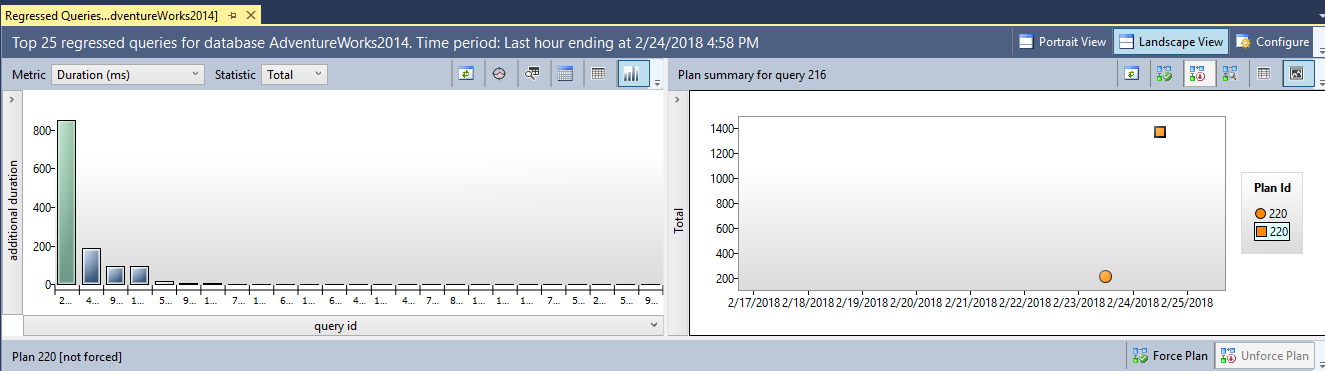
Regressed Queries
These reports by default show top 25 queries which execution matrices recently degraded (changed to worse).
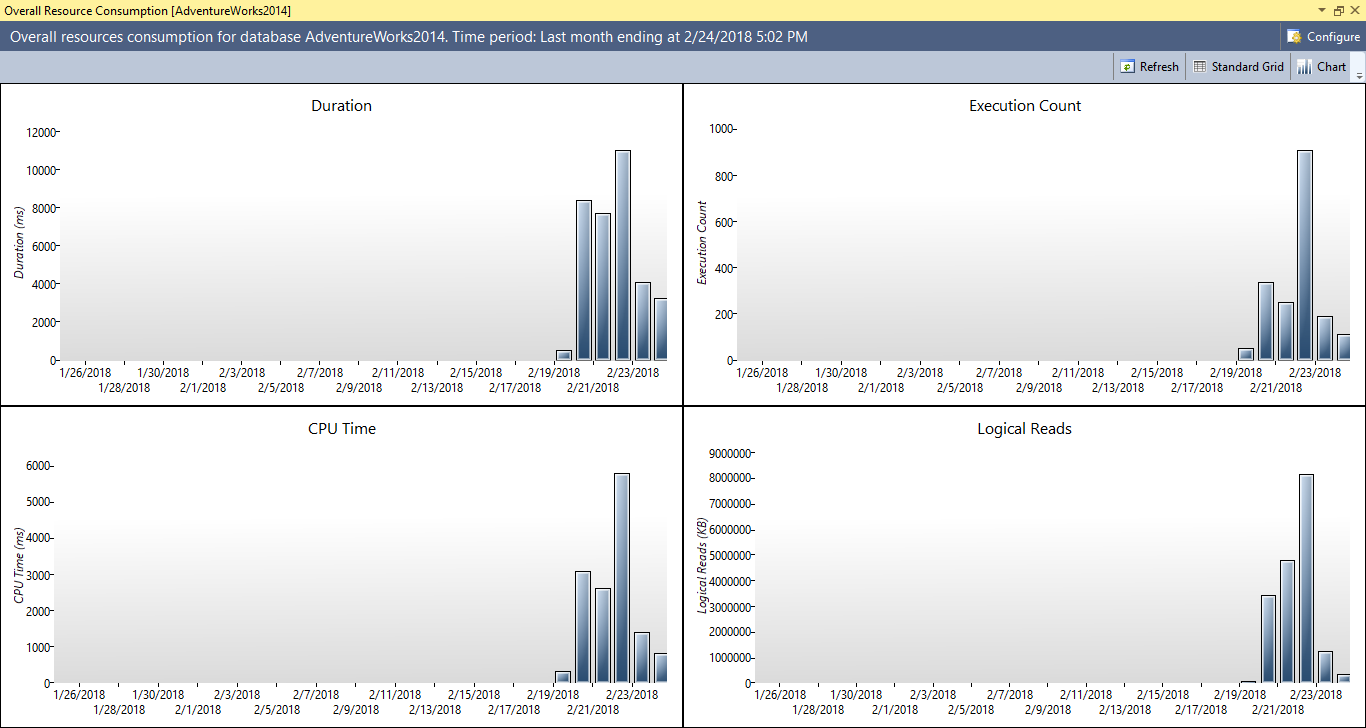
Overall Resource Consumption
This report shows total resource consumption for the database during specific period of time. This period of time is set by default to last month and results are shown in four charts: CPU Time, Duration, Execution count and Logical Reads:
The Top Resource Consuming Queries report shows top 25 queries for specific database that use most of the resources like Physical Reads, CPU Time, Logical Reads etc.:

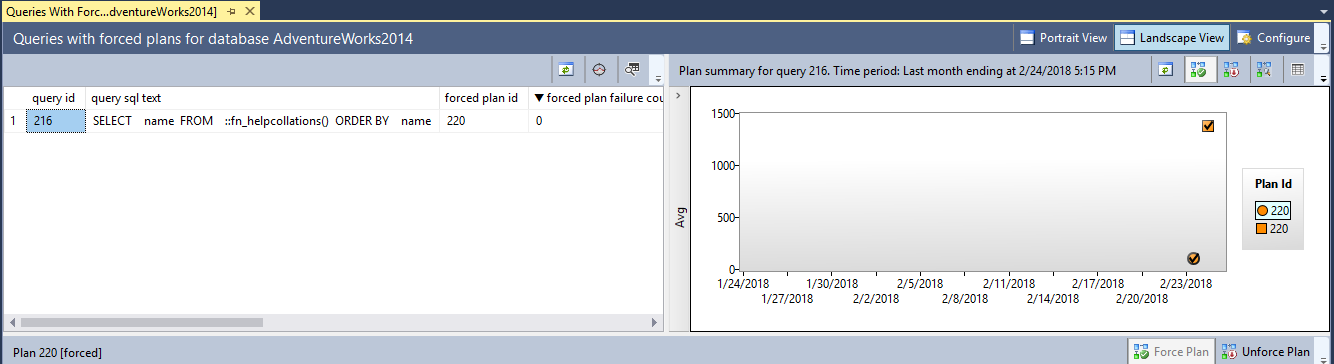
The Queries With Forced Plans report show all forced execution plans for specific queries:
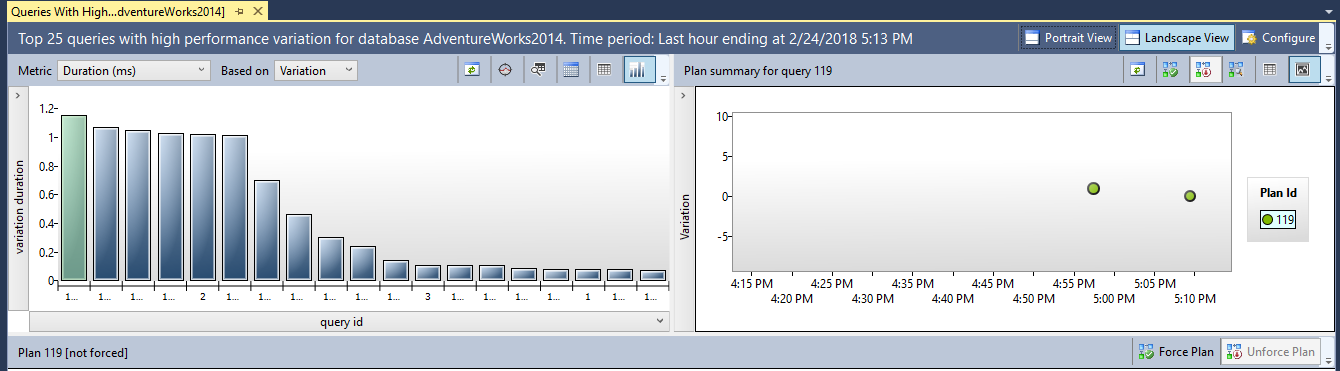
The Queries With High Variation report helps identifying the queries with the most severe parameterization problems:
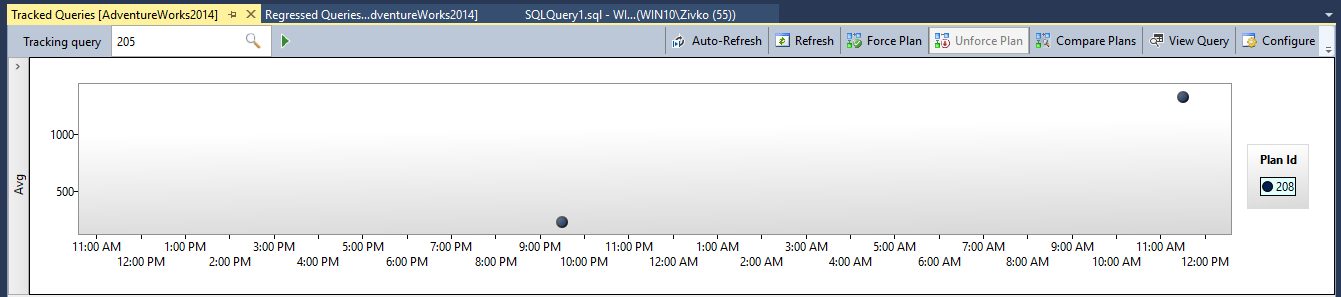
The Tracked Queries report can track query execution plans and query runtime statistics for specific query. In the Tracking query box, enter the query id and press the search (green) button next to the box:
OpenQueryStore
This feature has the similar functionalities as the SQL Server Query Store. The main difference is, in fact that Open Query Store is open source feature while SQL Server Open Query Store is not. Open Query Store supports SQL Server versions from 2008 through 2014 while Query Store supports SQL Server 2016 version and higher.
There are two different ways to install Open Query Store. One is by using automated setup and other is manually by modifying and executing installation scripts.
Here, manual installation will be explained with the Classic data collection mode.
Classic data collection mode is used when want to install Open Query Store on database level as the SQL Server Query Store, which means that the query runtime execution statistics will be collected and stored in the database on which is Open Query Store is installed. All collated data will be stored in the oqs objects.
There is one more data collection mode and that is Centralized mode. This mode is used when want to collect the query runtime execution statistics from multiple databases inside the same SQL Server instance and stored that data in one separate database
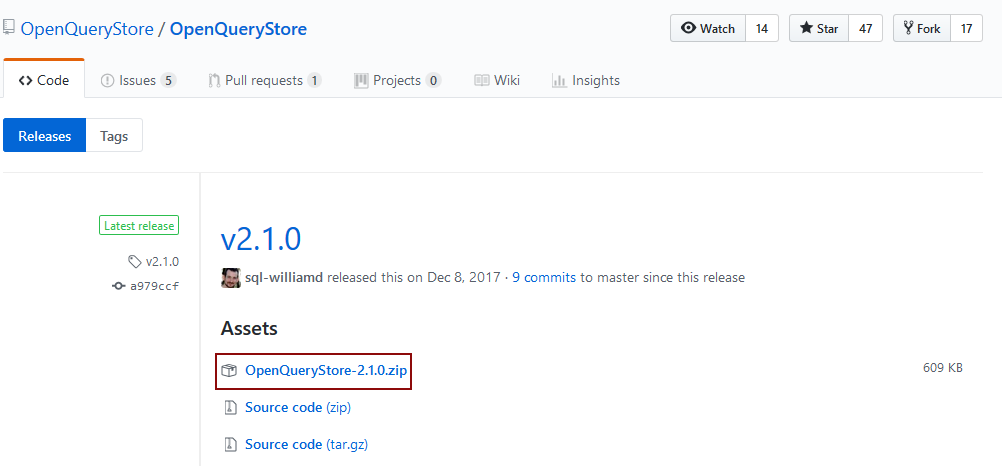
To start installation process, first installation script need to be downloaded. From the OpenQueryStore release page, download the latest version of Open Query Store:
After downloading, unzip the Open Query Store file:

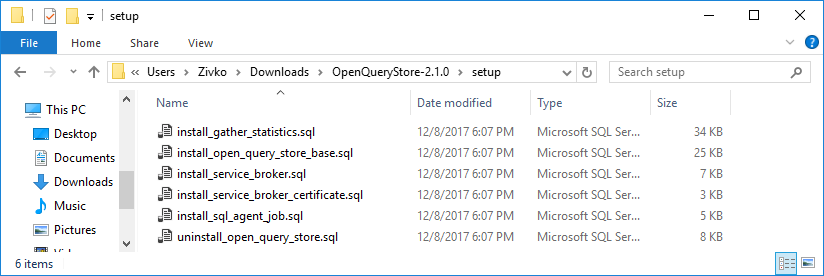
All files (scripts) needed for manual installation are located under the setup folder:
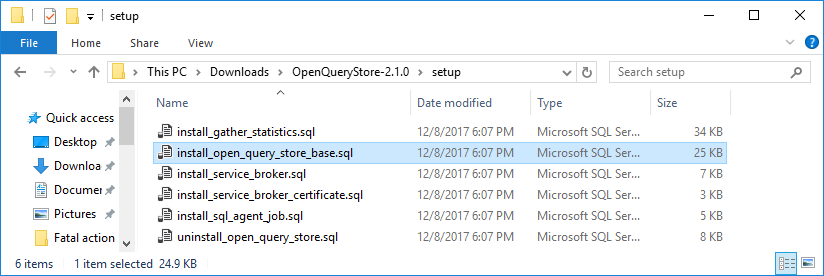
The first script from the setup folder that need to be executed as part of the install process is install_open_query_store_base.sql scrpt:
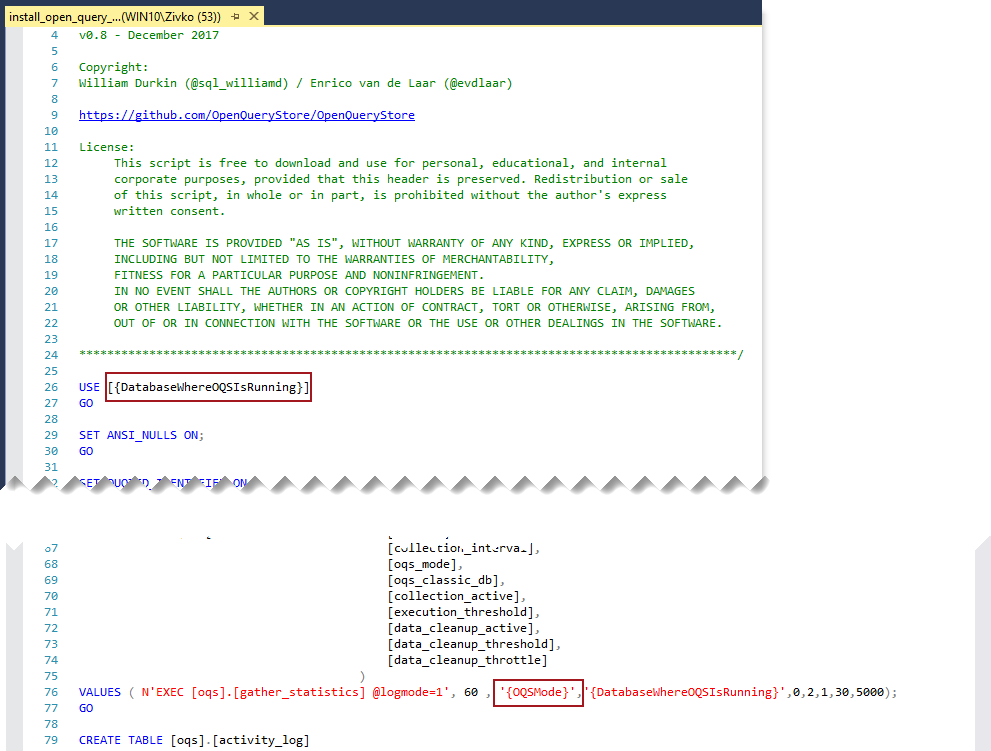
Before executing, in this script, it needs to be modified first. Open the install_open_query_store_base.sql script in SSMS and the values inside the brackets {} replace with appropriate values. For example, the {DatabaseWhereOQSIsRunning} value should be replaced with the database name on which want to install Open Query Store, in this case, that will be the [AdventureWorks2014] database and {OQSMode} value will be replaced with appropriate mode (Classic, Centralized); in this case the Classic mode will be chosen:
After changing values in the brackets {}, execute the script.
These steps should be repeated for the install_gather_statistics.sql, install_service_broker.sql, install_service_broker_certificate.sql scripts.
More about Open Query Store can be seen on the OpenQueryStore for SQL Server – Installation and configuration article.
To visualize data that collected Open Query Store and show them in separate various chart formats, the Open Query Store Dashboards needs to be installed.
The installation files for the Open Query Store Dashboards are located under the Dashboards folder of the downloaded OpenQueryStore folder:

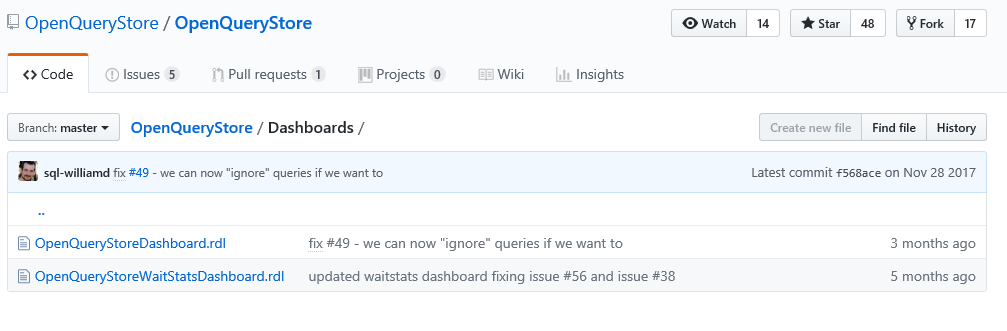
Or under the OpenQueryStore Dashboards GitHub page, download the OpenQueryStoreDashboard.rdl and OpenQueryStoreWaitStatsDashboard.rdl files:
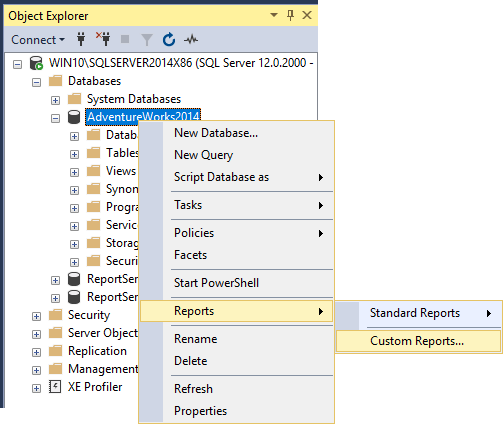
To install those files, open SSMS 2016 or higher, in Object Explorer, select the database on which is installed Open Query Store, right click, from the context menu, in the Reports submenu, select the Custom Reports option:
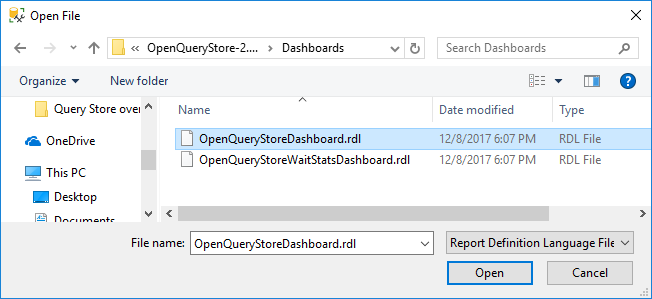
Find and select the OpenQueryStoreDashboard.rdl or OpenQueryStoreWaitStatsDashboard.rdl files and press the Open button:
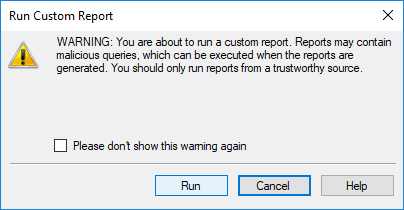
To continue in the Run Custom Report warning message box, press the Run button:
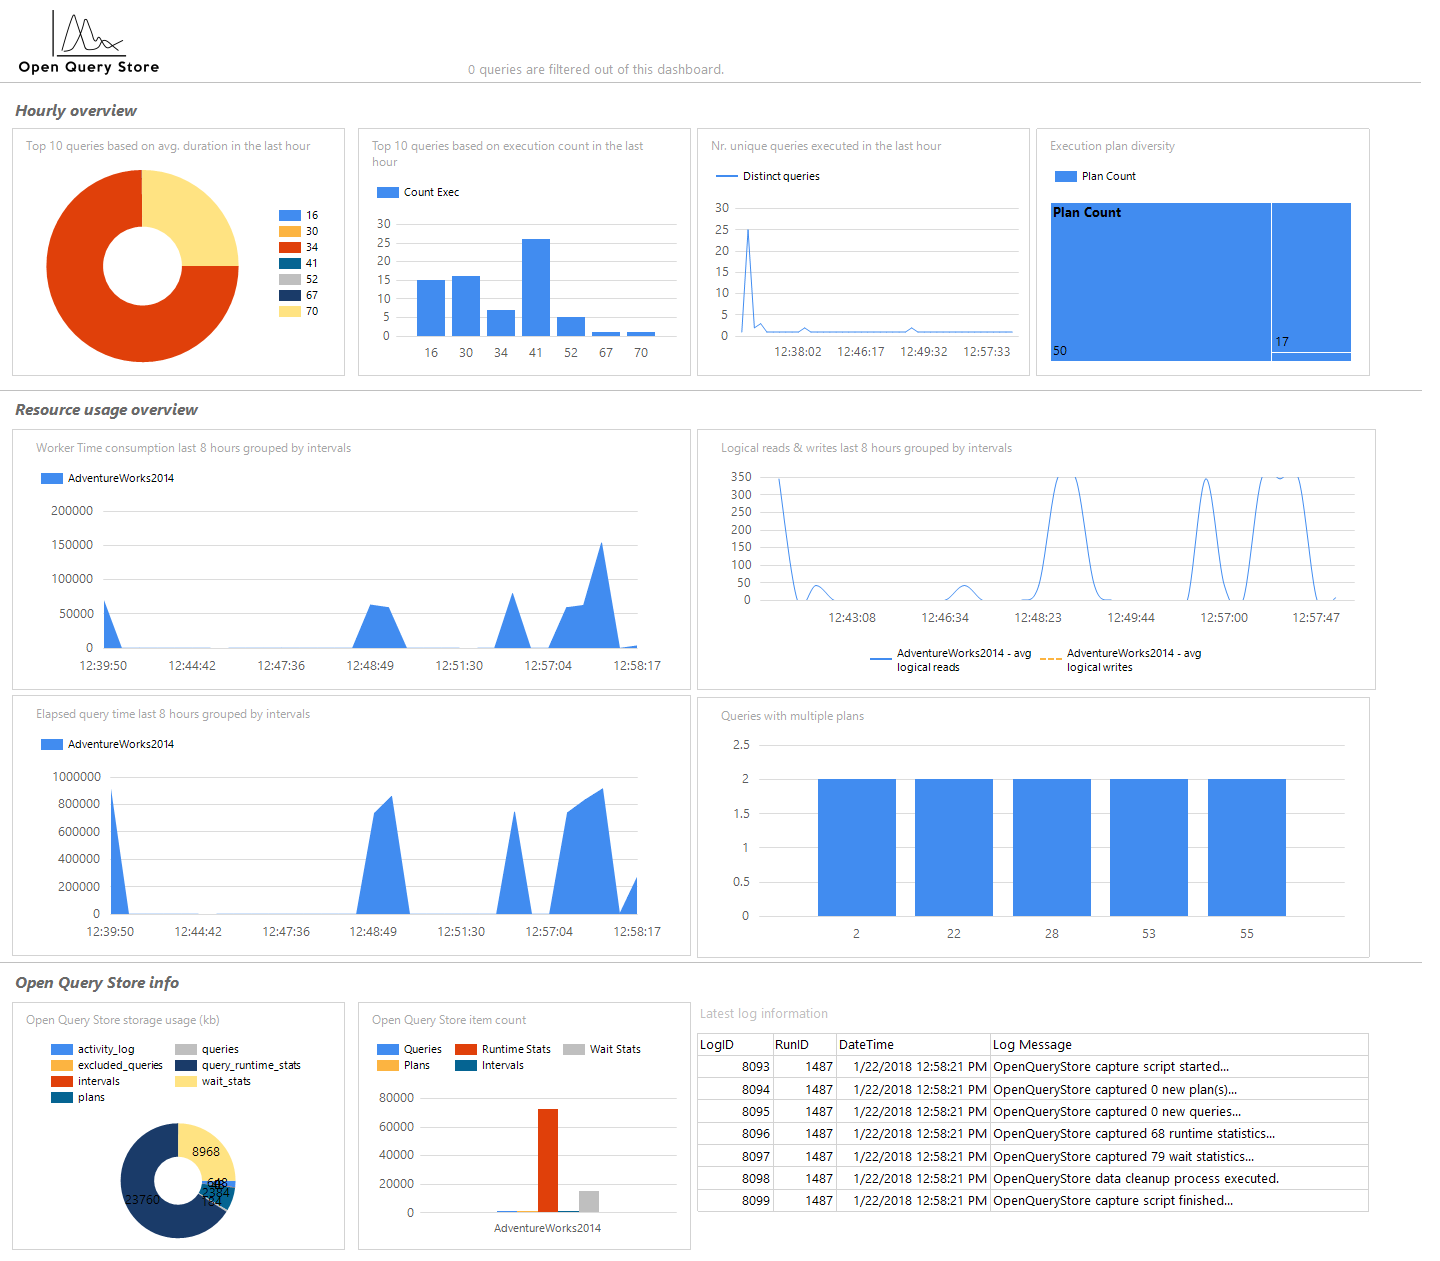
The dashboard will appear with data and charts:
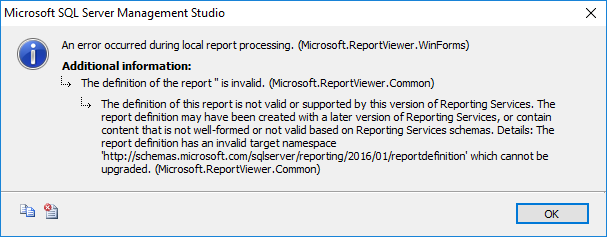
OpenQueryStore Dashboards are available for SSMS 2016 and higher. If you try to install dashboards using SSMS 2014 or SSMS 2012, this info message will appear:
An error occurred during local report processing. (Microsoft.ReportViewer.WinForms)
ADDITIONAL INFORMATION:
The definition of the report ” is invalid. (Microsoft.ReportViewer.Common)
The definition of this report is not valid or supported by this version of Reporting Services. The report definition may have been created with a later version of Reporting Services, or contain content that is not well-formed or not valid based on Reporting Services schemas. Details: The report definition has an invalid target namespace ‘http://schemas.microsoft.com/sqlserver/reporting/2016/01/reportdefinition’ which cannot be upgraded. (Microsoft.ReportViewer.Common)
ApexSQL Plan Query store
As it is mentioned early in this article, ApexSQL Plan is system, SQL Server, and database performance monitoring and alerting tool, that helps with performance issues detection and analysis.
ApexSQL Plan has the Query store feature that is similar with Query Store and Open Query Store monitoring the query execution plans, query runtime statistics and shows results in various chart formats.
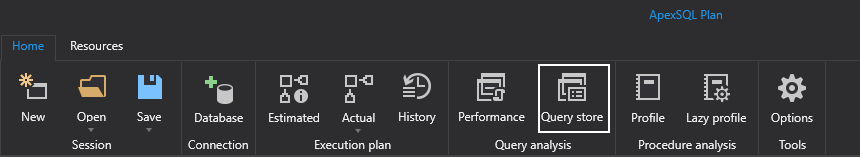
In the Home tab, click the Query store command:
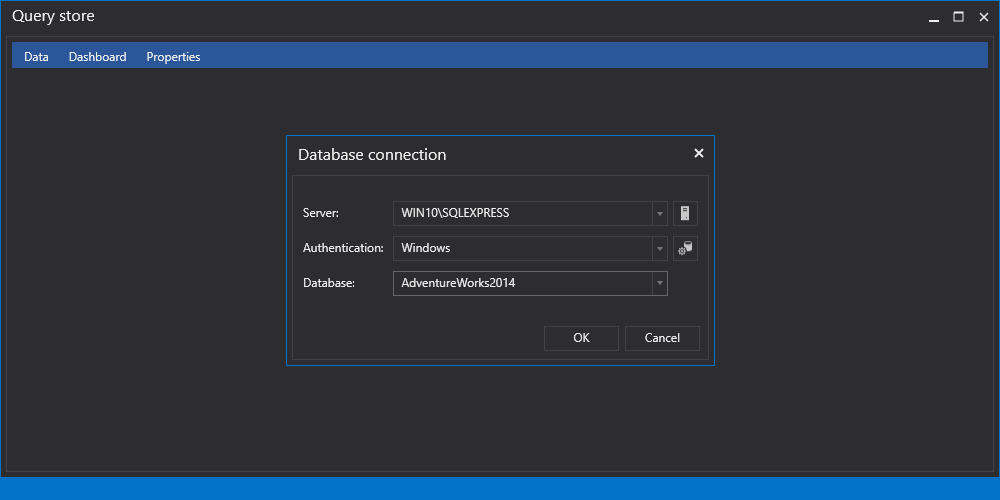
In the Database connection window, provide appropriate credentials for database on which want to enable Query store and press the OK button:
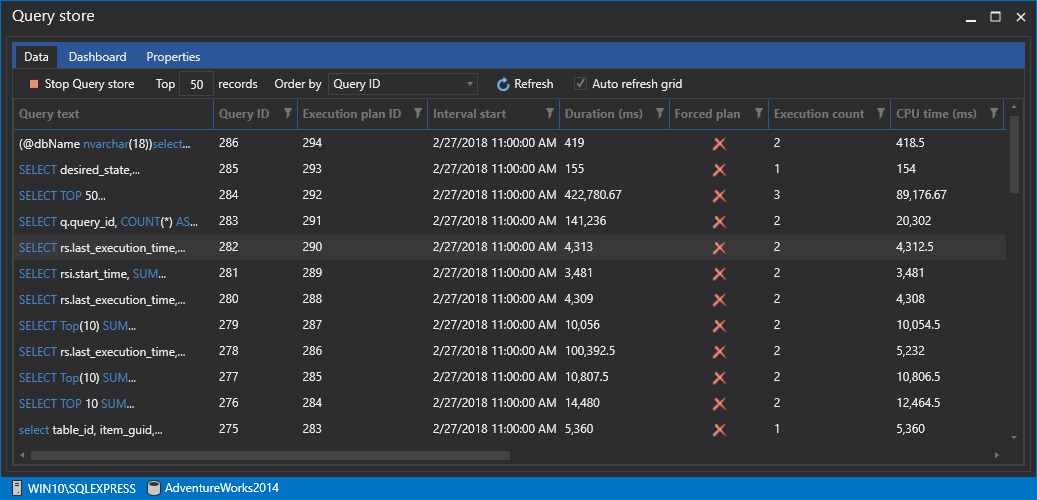
To Query store start collecting data, press the Start Query store button in the Data tab:
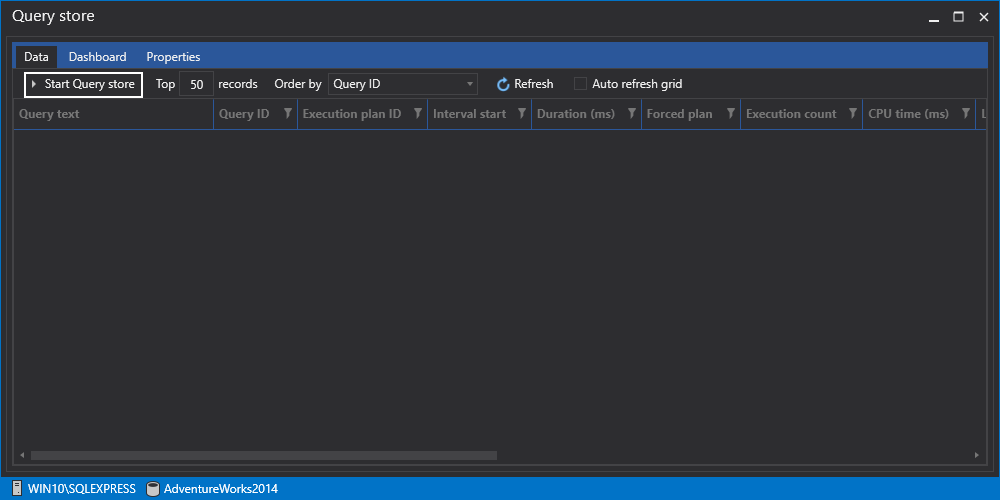
After a while the collected data will start appearing in the Data grid:
To visual see collected data grouped in various charts, go to Dashboard tab:
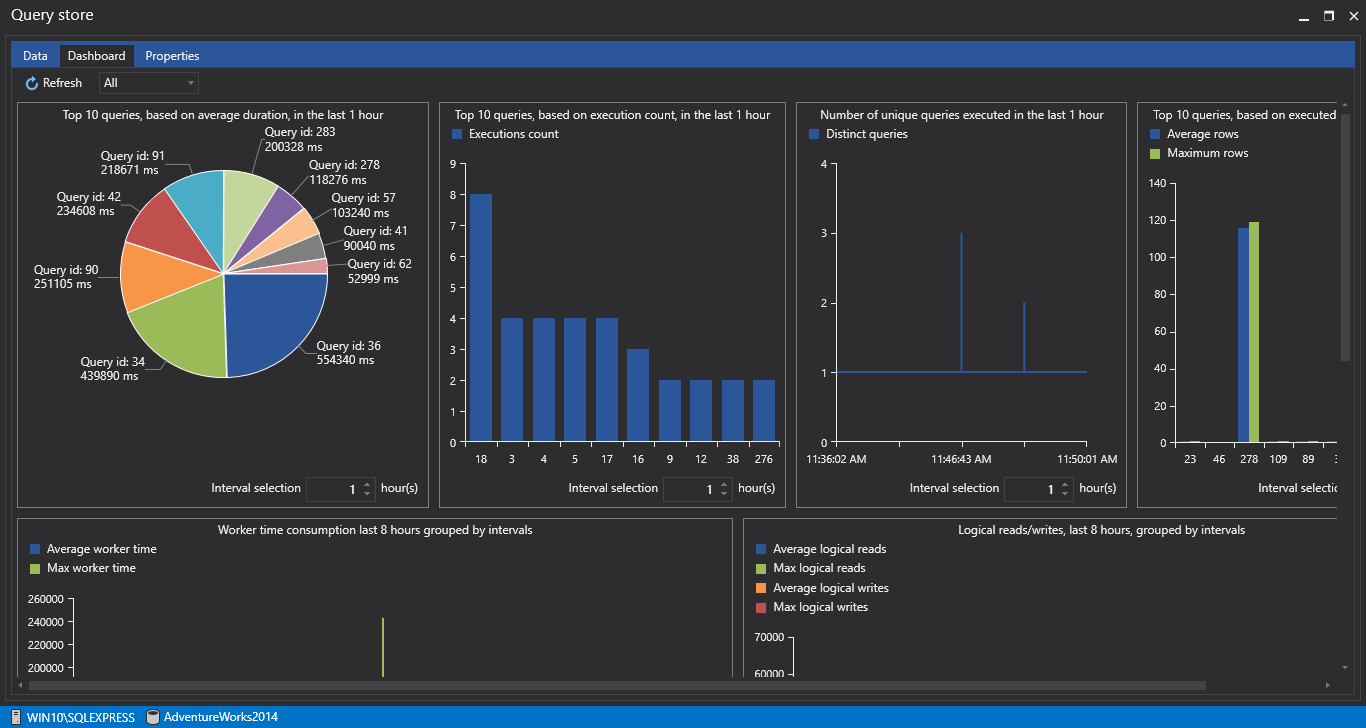
Here, top 10 queries, based on average duration, top 10 queries, based on execution count etc. can be seen.
The Query store options can be set under the Properties tab:
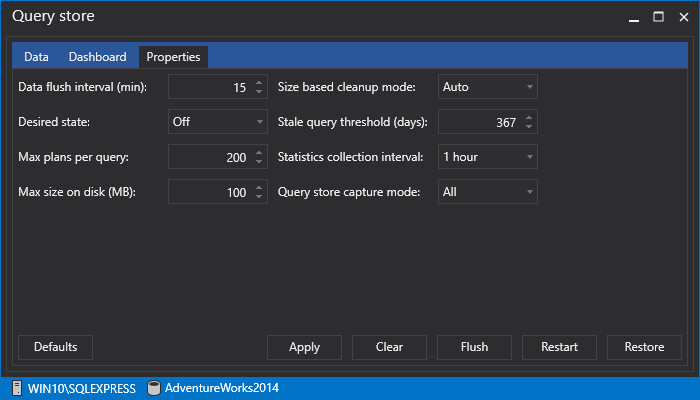
The options under the Properties tab are the same as the options under the Query Store feature that are described earlier in this article.
The main advantages of ApexSQL Plan Query store in comparing to Query Store and Open Query Store are simplicity in enabling and setting options and in fact that ApexSQL Plan Query store supports SQL Server 2008 and higher while Query Store supports SQL Server 2016 and higher and Open Query Store support SQL Server 2008 to SQL Server 2014.
See also:
- OpenQueryStore for SQL Server – Installation and configuration
- SQL Server Query Store – Overview
- Monitoring performance by using the Query Store
March 5, 2018


