SQL execution plans AKA SQL explain plans are one of the greatest assets when it comes to tuning, optimizing, and troubleshooting our queries. Transact-SQL is a declarative language that can be used to query data without requiring a human interaction to specify an exact SQL execution plan to be followed. This simply means that we are not telling SQL Server how to go and fetch the data, we’re just telling it what data we want it to get. So, think of an execution plan in SQL Server as a map. It is a map that the query optimizer is drawing that represents an efficient SQL execution plan to retrieve the data.
From our point of view having access to these maps provides us with a whole welt of information on how SQL Server fetches the data under the hood and it can answer a lot of questions. One of the most asked questions is why is this query running so slow? So, in this article, we’re going to get familiar with SQL execution plans and see how we can use them to tune and troubleshoot slow running queries. Furthermore, we’re going to mention top things that we need in a SQL execution plan analysis tool.
One of those tools is ApexSQL Plan. Deployed both as a standalone application and an SSMS add-in, ApexSQL Plan is a free query analysis and optimization tool for the database administrator who is looking to detect issues that affect the database query speed and work to remove such deadlocks. Furthermore, this tool can build an overview of the query performance and has the must-have features for you to analyze wait times for executed queries, or check the costs of all operations in the graphical SQL execution plan, etc.
Let’s start at the top level and take a high-level look at what the execution plan in SQL Server is all about. We pretty much explained the basics in the intro, but here’s the quick recap and a few additional notes of what executions plans are:
- Shows how query results were or will be retrieved
- Detailed map of type and order of operations
- Plans can help diagnose problems or tune queries
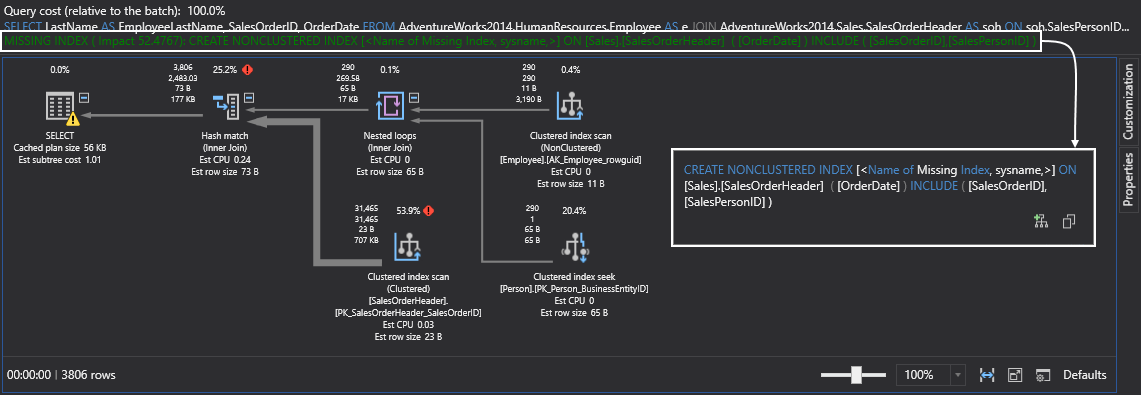
The very first thing that we need in a SQL execution plan tool is a graphical execution plan. Here is an example from ApexSQL Plan:
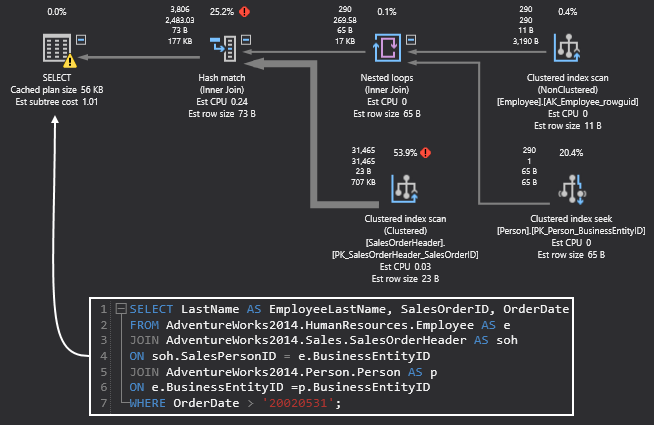
What you need to know in this graphical SQL execution plan is that the execution of the plan starts from left to right. On the opposite side, we have data flow from right to left and that’s how SQL Server gets the data. So, when you’re looking through the plans, you really want to start by analyzing them from right to left. The plan itself should contain the following essential information about query execution:
- Type of operations
- Order of operations
- Indexes to use
- Row count estimates from stats
- Row count actual from results
In other words, the plan itself should contain steps. All of these steps are known as operations. The plan shows the type of operation that was performed and the order. That’s why everything is connected in the flow diagram. One of the more important things we can get from these is to see if the indexes are used because it shows us the exact indexes that are used to fetch the data. When it comes to indexes, a must-have thing that these tools should have is the missing indexes creation. This feature can help with making the best possible decisions about your indexes. For example, use the query below to get an SQL execution plan:
SELECT LastName AS EmployeeLastName, SalesOrderID, OrderDate
FROM AdventureWorks2014.HumanResources.Employee AS e
JOIN AdventureWorks2014.Sales.SalesOrderHeader AS soh
ON soh.SalesPersonID = e.BusinessEntityID
JOIN AdventureWorks2014.Person.Person AS p
ON e.BusinessEntityID =p.BusinessEntityID
WHERE OrderDate > '20020531';
ApexSQL Plan will not only show the SQL execution plan but it will also point out that there’s a missing index:
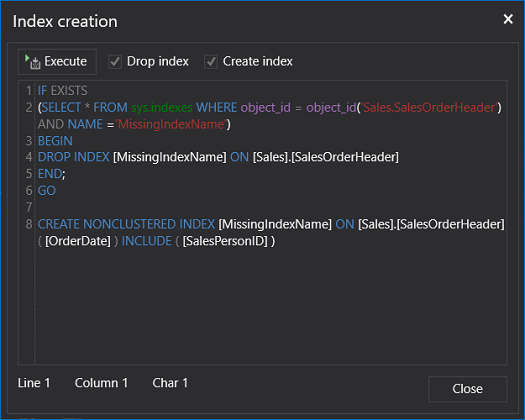
From here, it’s up to the user to either copy the creation script to the clipboard and use it later or open the Index creation window and execute it right away against the targeted database:
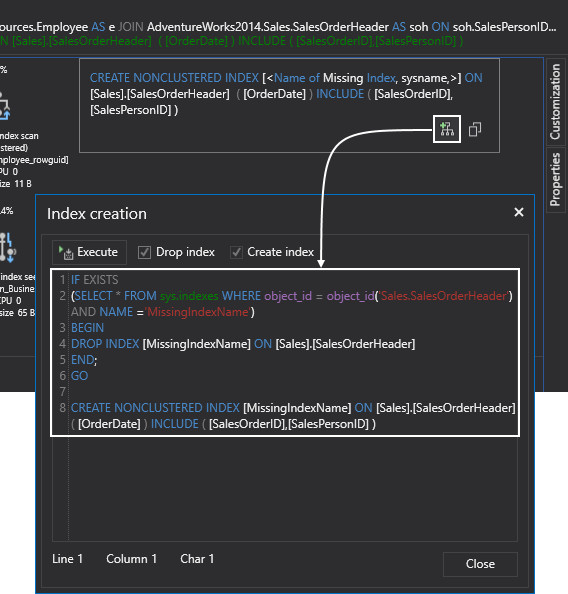
Just like an index in a book, an index in SQL Server is designed to save time when SQL Server is trying to look up information. Bear in mind that creating indexes requires analysis because in general, they are most effective when a table contains a large number of records but they can also backfire and end up adding significantly more time to Insert, Update, and Delete statements. Furthermore, keep in mind that indexes take up disk space as any other type of data does.
Here’s a list of articles that can help you with query performance tuning when it comes to indexes:
- How to create and optimize SQL Server indexes for better performance
- How to identify and solve SQL Server index scan problems
- How to optimize SQL Server query performance – Statistics, Joins and Index Tuning
When the SQL execution plan is complex with a lot of operators, try to break it down, piece by piece and then it’s just the matter of identifying the hot spots, finding the areas in the query that are not performing well, can be tuned, rewritten or indexed and then taking action. This might sound like easier said than done but this can actually be pretty easy to do. We got a lot of information in the tooltips that is displayed when the mouse is positioned over an operator. Here is an example of a tooltip from the hash match (inner join) operation:
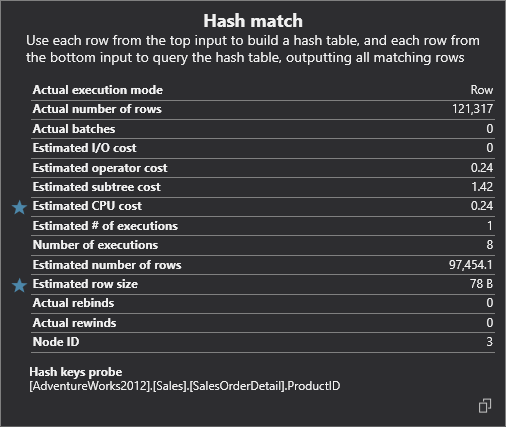
The tooltips are very neat as they provide additional information that can help with the cost base analysis like percentage attached, I/O cost, CPU cost, memory consumption, description of the operator itself, etc. The information displayed in the tooltips may differ depending on the type of operation.
Moving on, also worth mentioning, are row counts. As we said before, there’re two types: estimated and actual. Just by comparing those two we can identify if the SQL Server is using the right SQL execution plan or if our statistics (find out more about statistics by reading the article above) are out-of-date. Just look at the example from the screenshot above. Estimated and actual number of rows are widely off. Such a big difference in the number of returned rows means that statistics are out-of-date and here’s the elaboration why…
The Estimated execution plan in SQL Server is a compile-time plan of what might happen (statistics). SQL Server will accept the query we submitted, read the statistics, and show us the plan that it will most likely use to fetch the data. This, of course, means that there’s a chance the plan generated using statistics is inaccurate. This type of plan is popular/useful when dealing with inserts, updates, deletes… those statements should not be run just to see the SQL execution plan anyway.
The Actual execution plan in SQL Server as the name implies is the real plan of what really happened to retrieve the results. Simple as that.
In ApexSQL Plan both SQL execution plans can be generated from the Management tab under the SQL Execution plan ribbon:
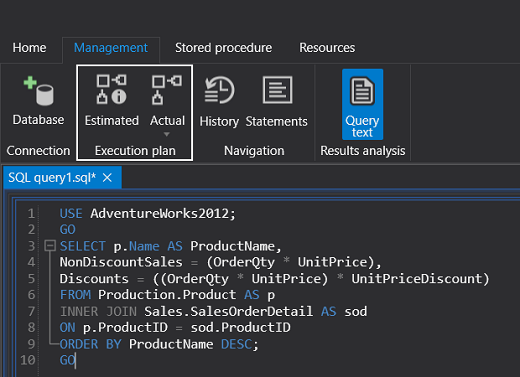
In addition to those two, there’s also an ability to view the live SQL execution plan of a query. This type of plan provides real-time insights into the query execution process as the controls flow from one operator to another. To view the live query execution plan in SQL Server, on the Actual icon click the arrow pointing down and choose the Live icon:
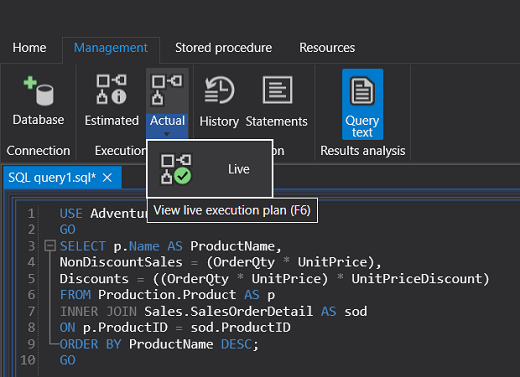
Execution plans in SQL Server can be very useful for debugging query performance issues because data is available in real-time without needing to wait for the query to complete.
Query performance is not only the initial query design, but also continuous monitoring and troubleshooting, so this should also be an iterative process. The Query Store is a feature that was introduced in SQL Server 2016. It is designed to troubleshoot and solve performance issues related to changes in SQL execution plans by capturing the history of queries, runtime statistics, identifying expensive queries and their SQL execution plans. In ApexSQL Plan you can set and use the Query store in a few easy steps.
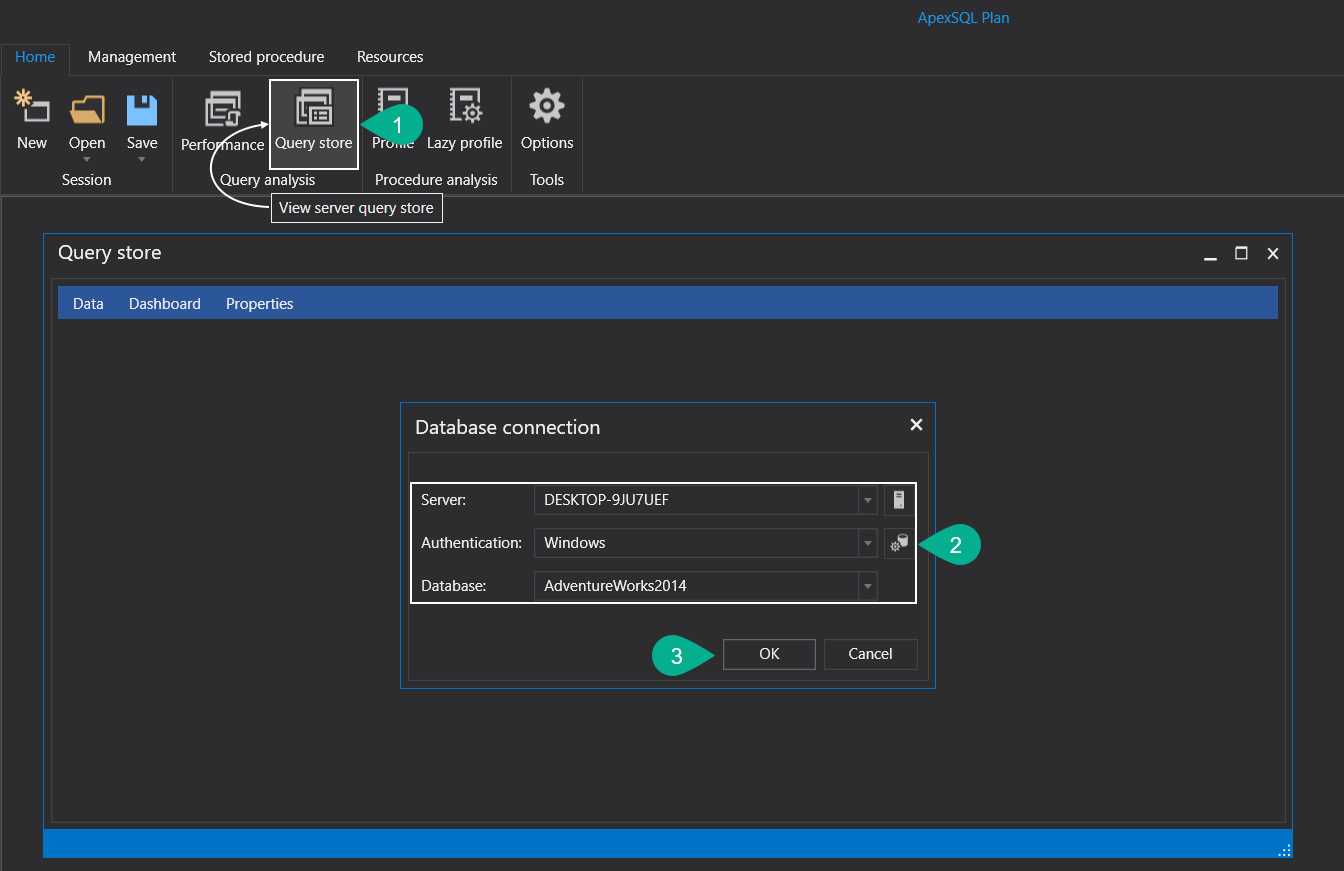
To start monitoring queries performance, under the Home tab, press the Query store (1) button:
This will open the Database connection window inside the main Query store window. Here, just choose the Server, Authentication method, Database (2) to be monitored and hit the OK (3) button to proceed.
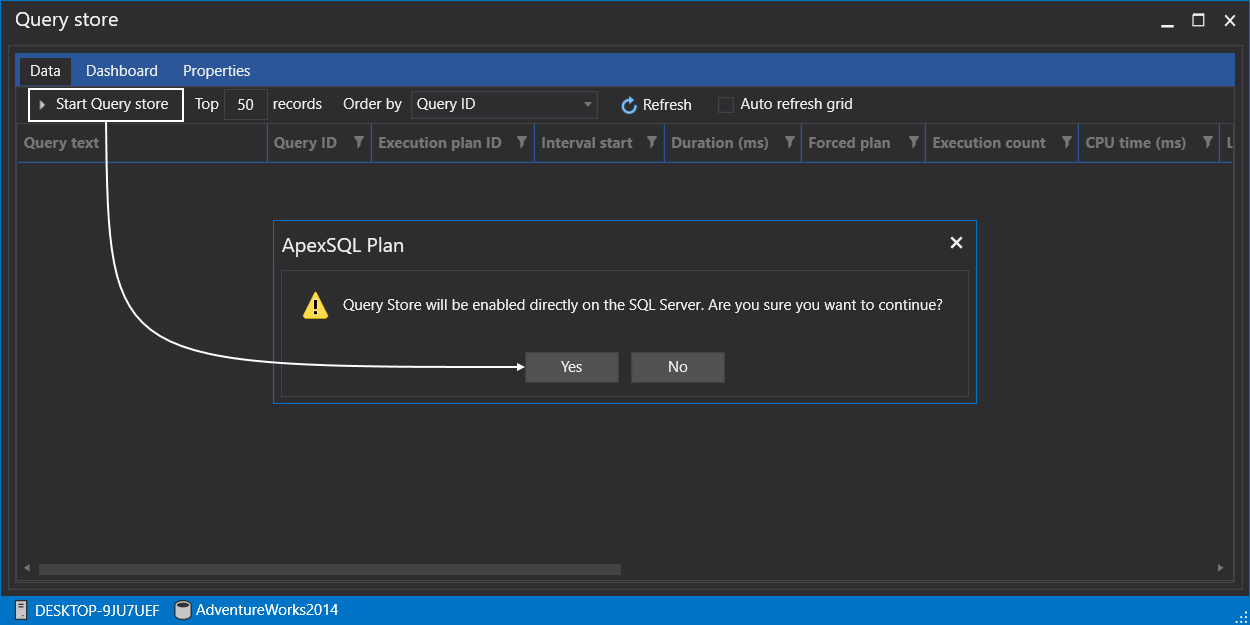
As a final step, click the Start Query store button and then the Yes button to allow the application to enable SQL Server Query store on the targeted database:
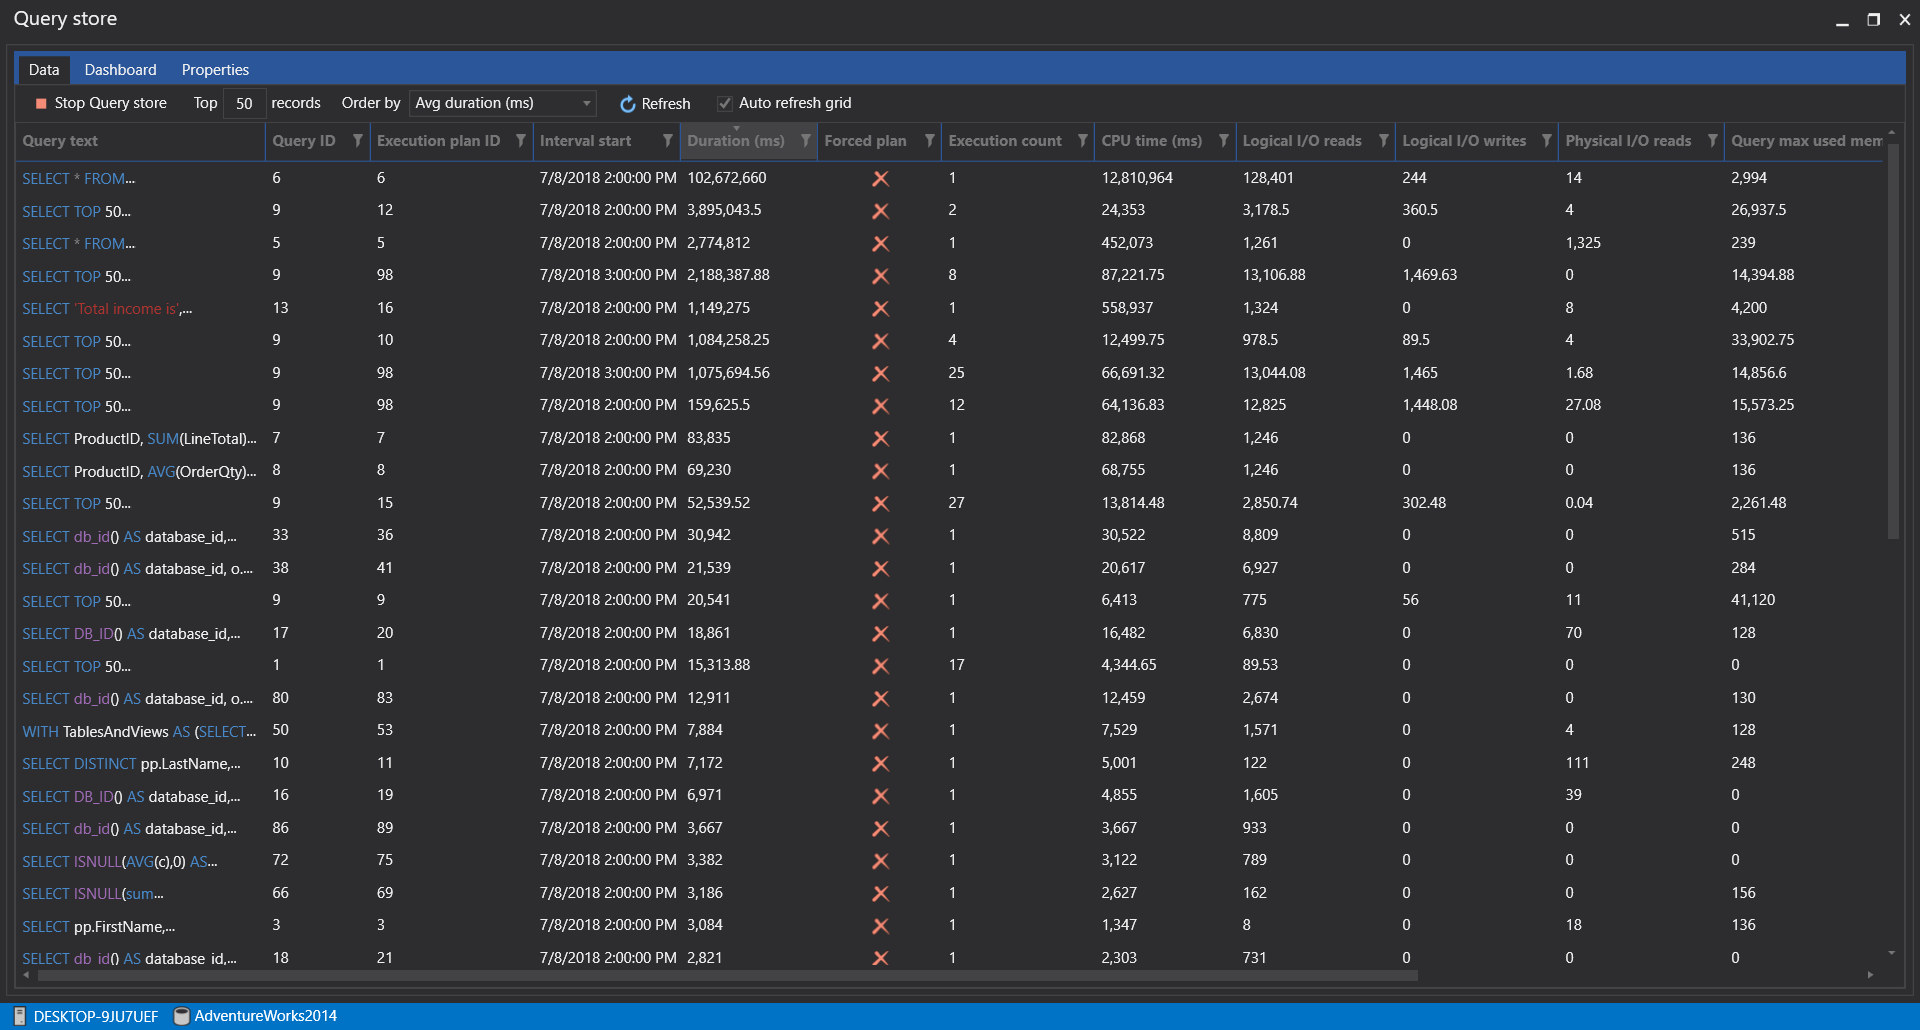
Let it run for a while in the background and the captured data will be populated in the Query store window:
From here, any data in the columns can be sorted out for easier reading. For example, the Duration column is sorted and the most expensive query is shown at the very top. In this particular case, it took 102,672,660 milliseconds which is an extremely long period. To troubleshoot this query, let’s take a quick look at the SQL execution plan. Just right-click the problematic query and from the right-click context menu choose the View execution plan command:
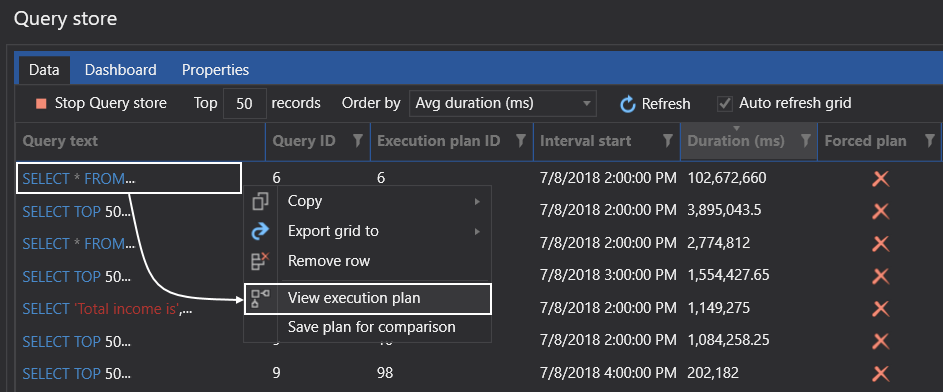
This will open a new query editor text tab and place the script in it right from the Query store window. Just by looking at the estimated number of rows we can see that something is off. With such a high number of results, it’s best to generate an estimated plan as the actual would require the query to actually finish fetching the data:
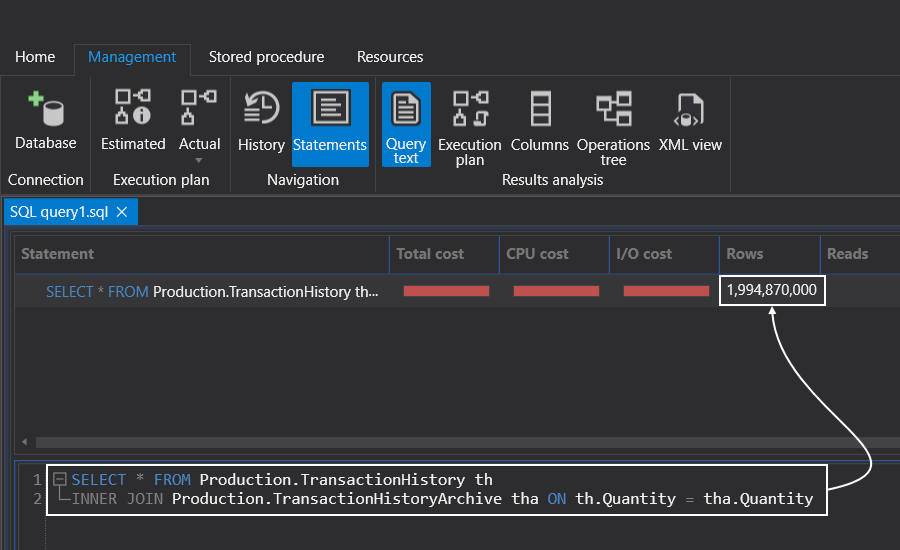
The result of this query is a very artificial example. We took two tables with the most rows in our sample database and did an inner join on unindexed tables. This is one of those queries that could run for hours in the background without us even knowing it. Operation tooltips are not the only tooltips available. Almost every graphical item in the map has additional information when the cursor is positioned over it:
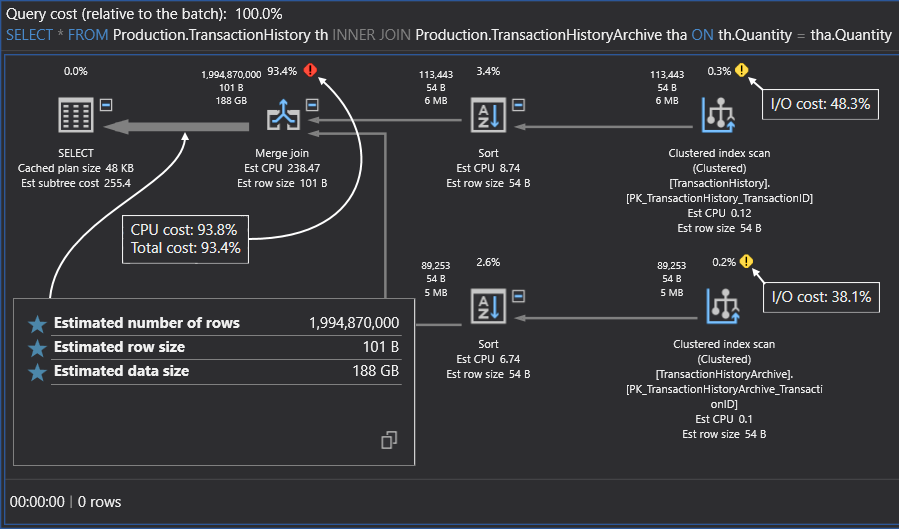
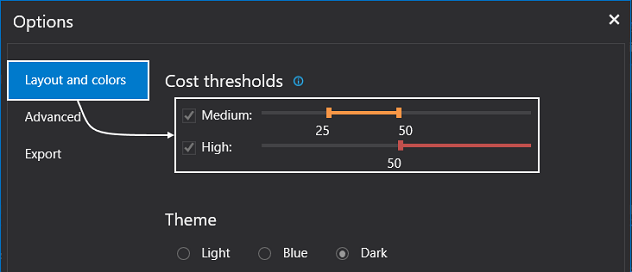
Cost thresholds are displayed beside an operator and those can be configured under the Layout and colors tab of the options dialog:
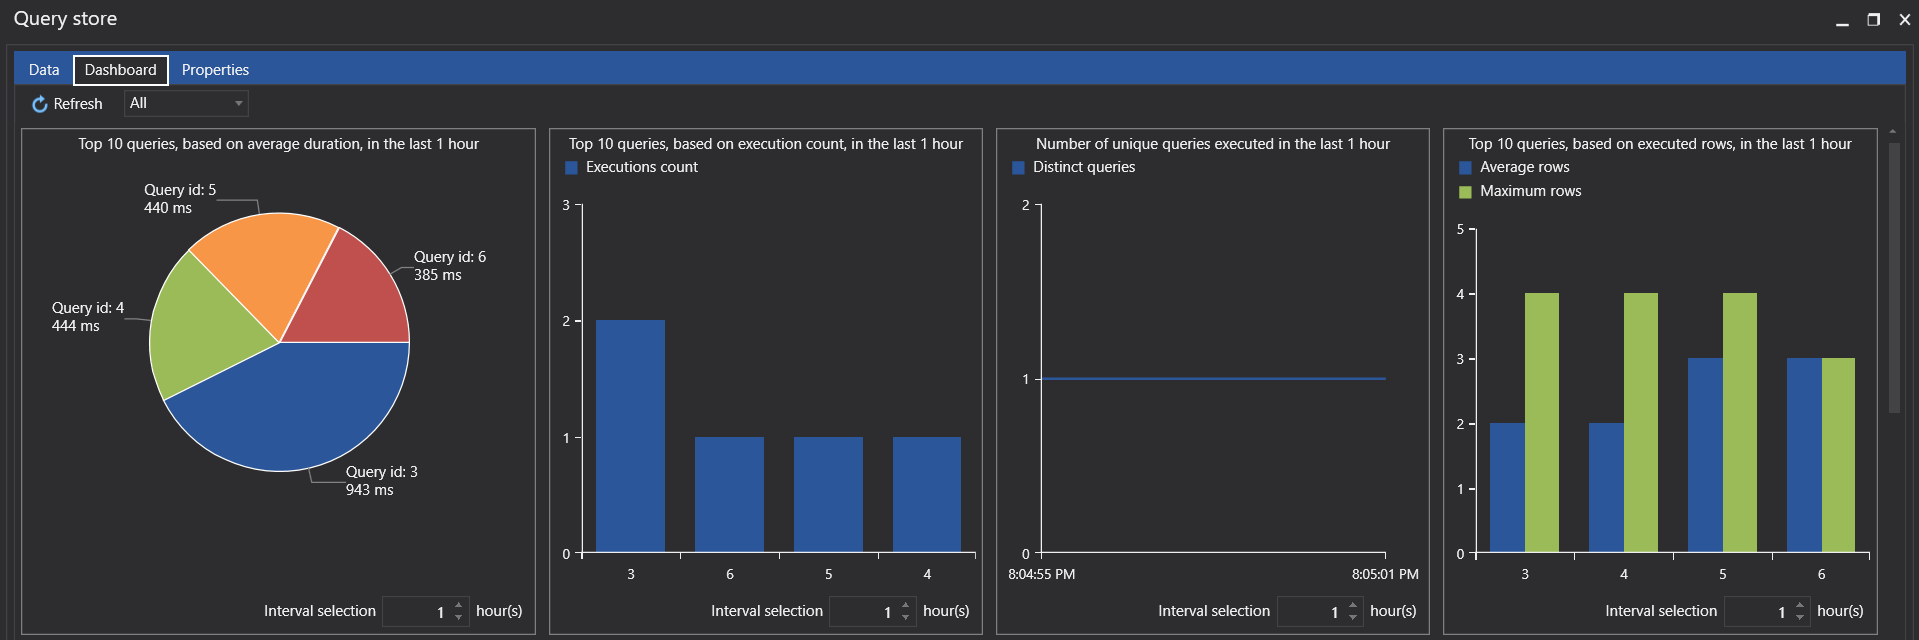
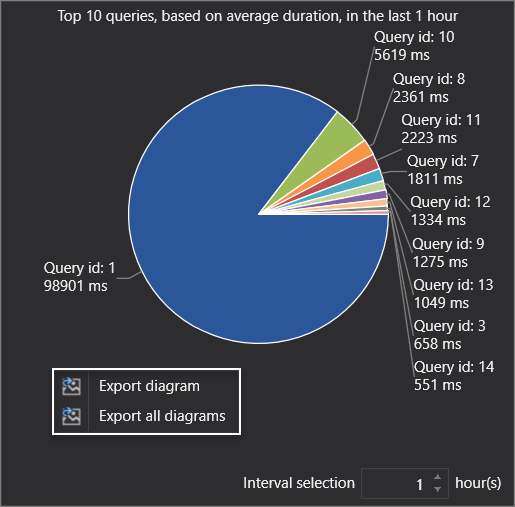
Numbers can be sometimes hard to read. That’s why all the captured data in the Query store can be graphically presented in form of various graphs. To view them, just hit the Dashboard tab right next to the Data:
Each section of the additional query performance information can be exported as an image for later viewing e.g. presentation. Right-click any graph and choose either Export diagram to save only the current graph or Export all diagrams to save them all:
For more detailed information about SQL Server Query Store check out the following articles:
As mentioned above, the Query Store was first introduced in SQL Server 2016 but ApexSQL Plan offers Query Store functionality without SQL Server 2016. This is supported by installing OpenQueryStore as a part of regular Query Store which supports SQL Server 2008 and higher.
SQL Server Wait times are well-known cause of the slow running queries that can be used to track and troubleshoot query performance by identifying resource bottlenecks the query is waiting for. Queue waits occur when a worker is idle, waiting for work to be assigned. ApexSQL Plan can capture all wait times encountered by threads that are executed but the problem is how to resolve them. Why? Because there are so many.
Here’s the list of SQL Server wait types that can be encountered commonly. For the full list, please check the sys.dm_os_wait_stats (Transact-SQL) DMV on Microsoft docs.
ApexSQL Plan has Wait times descriptions that provide the information inside tooltips for each wait type. This information includes the description when it occurs, steps that can be taken to resolve it and external resources that could be used for in-depth troubleshooting (articles). Wait times descriptions are available from Wait times tab under the Results analysis ribbon:
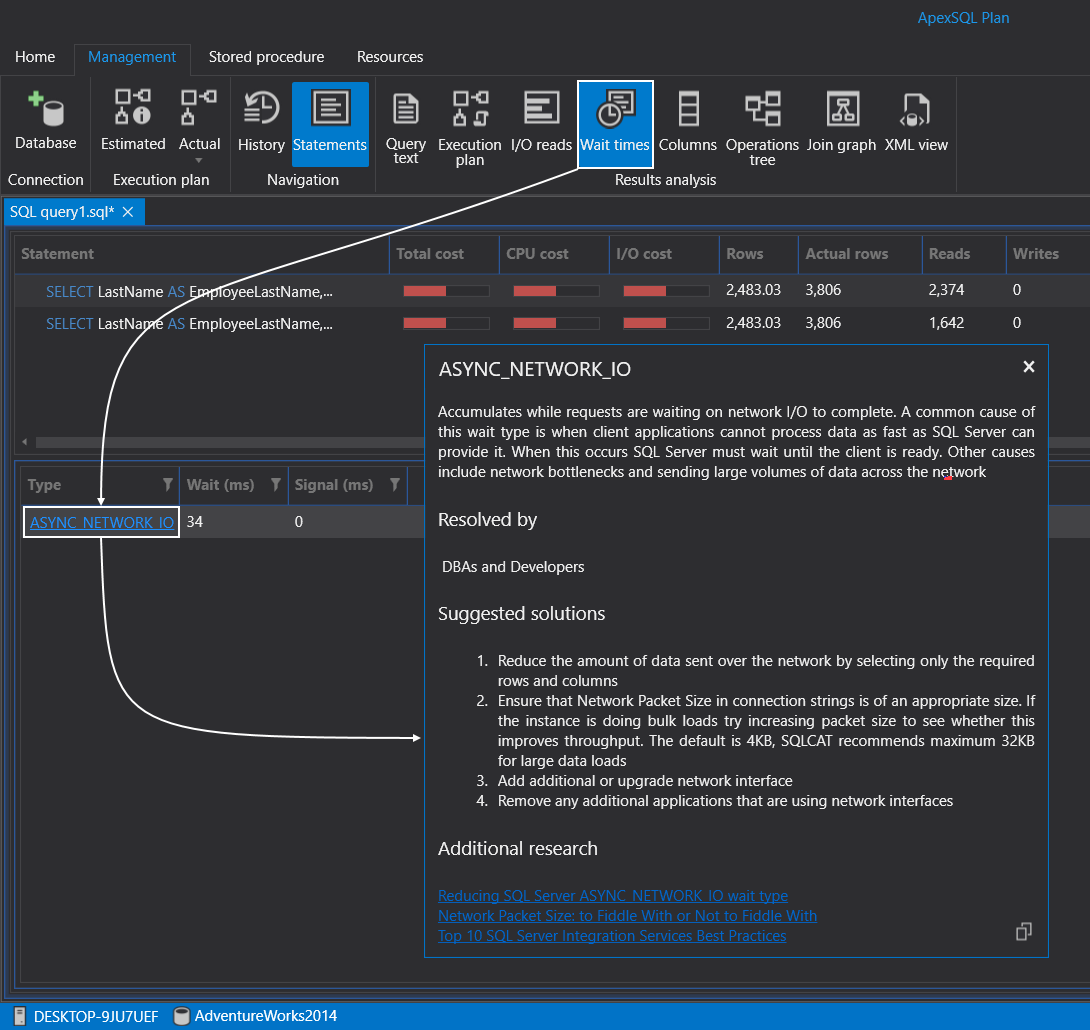
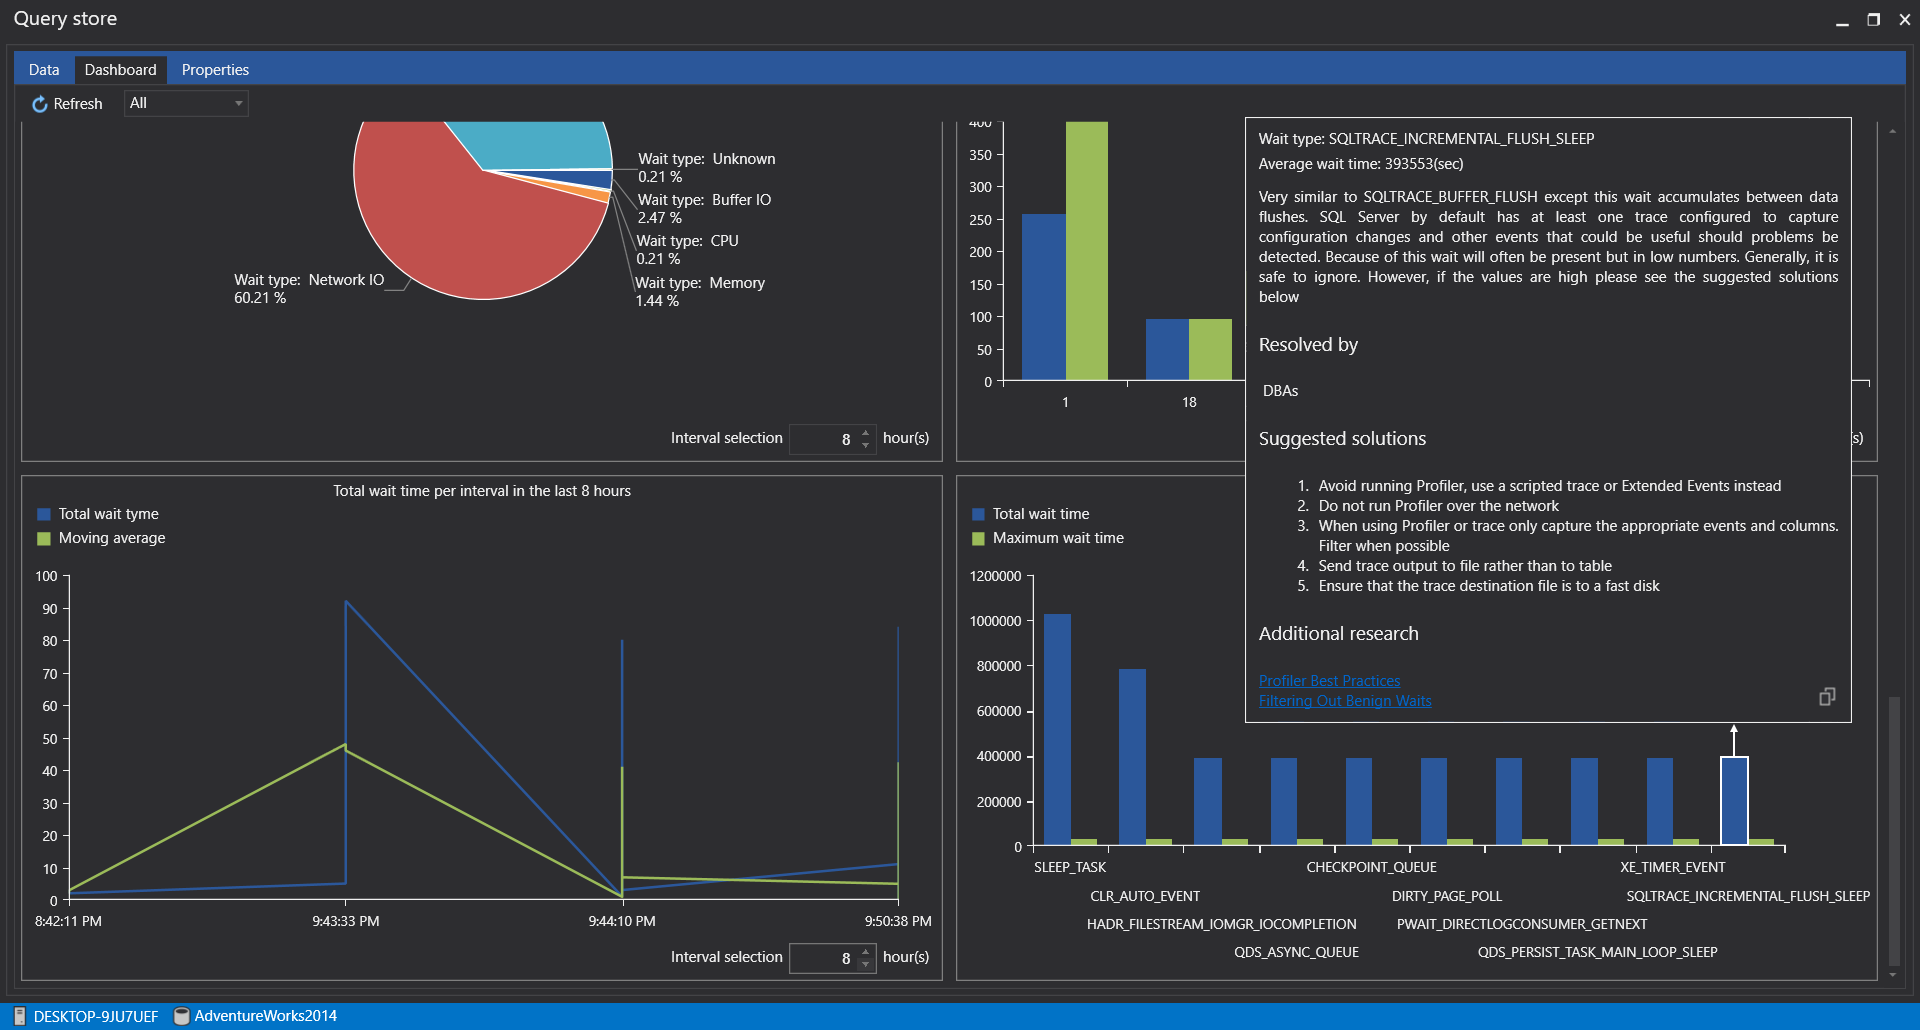
Wait times descriptions are also available directly from the Query store, under the Dashboard tab for Top 10 longest wait types graph. Just hover the mouse over a graph item and the tooltip will appear:
Another essential component when it comes to analyzing and optimizing SQL execution plans is their comparison. This feature allows a comparison of the current plan against a previously saved plan. To show this in an example, consider the following view in our sample database:
USE AdventureWorks2014;
GO
CREATE VIEW EmployeeName AS
SELECT h.BusinessEntityID, p.LastName, p.FirstName
FROM HumanResources.Employee AS h
JOIN Person.Person AS p
ON h.BusinessEntityID = p.BusinessEntityID;
GO
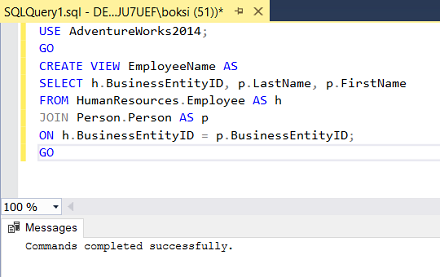
Paste the code in SSMS and run it:
Based on this view, paste the script below in ApexSQL Plan and get the actual execution plan in SQL Server:
SELECT LastName AS EmployeeLastName, SalesOrderID, OrderDate
FROM AdventureWorks2014.Sales.SalesOrderHeader AS soh
JOIN AdventureWorks2014.dbo.EmployeeName AS EmpN
ON (soh.SalesPersonID = EmpN.BusinessEntityID)
WHERE OrderDate > '20020531';
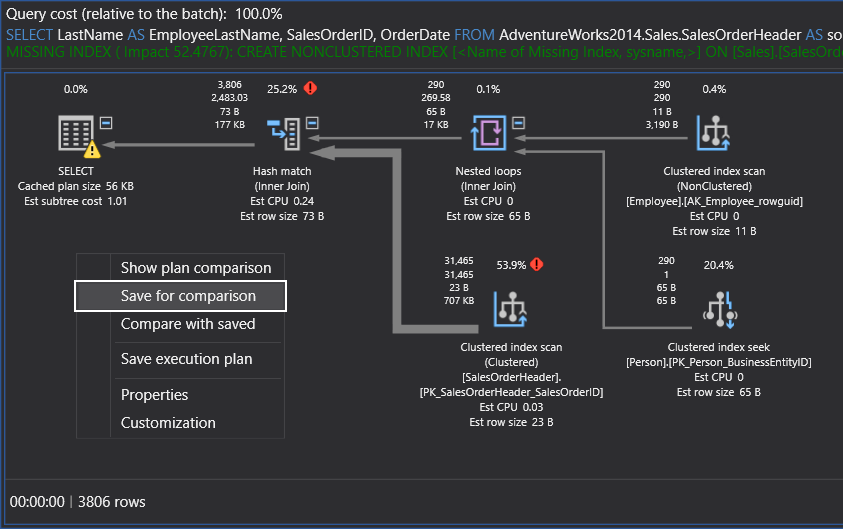
Right-click anywhere inside the graphical execution plan and from the context menu choose the Save for comparison option:
Create a new session, paste the script from below, and get the actual execution plan in SQL Server one more time:
SELECT LastName AS EmployeeLastName, SalesOrderID, OrderDate
FROM AdventureWorks2014.HumanResources.Employee AS e
JOIN AdventureWorks2014.Sales.SalesOrderHeader AS soh
ON soh.SalesPersonID = e.BusinessEntityID
JOIN AdventureWorks2014.Person.Person AS p
ON e.BusinessEntityID =p.BusinessEntityID
WHERE OrderDate > '20020531';
Right-click anywhere inside the graphical execution plan and this time choose the Compare with saved option:
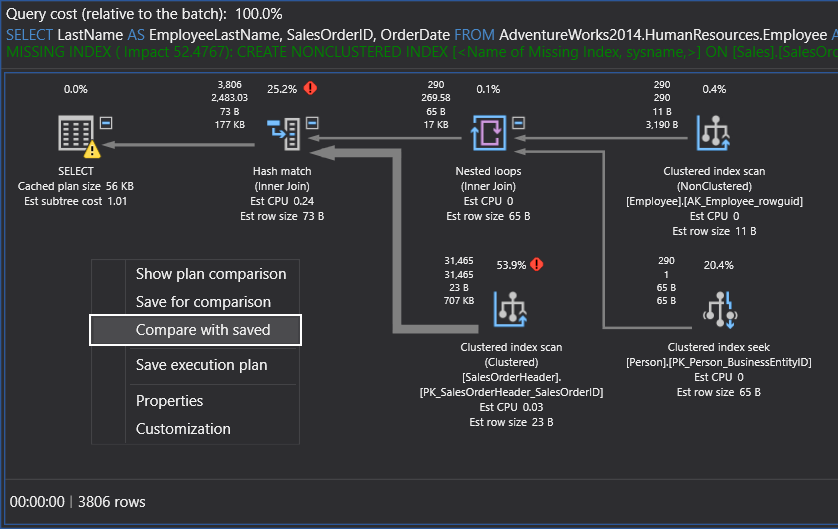
Both of these Select statements perform the exact same operations and fetch the same results. At this point, a comparison would show that the SQL execution plan is the same for both the Select referencing the EmployeeName view we previously created and the Person and Employee tables directly. So, let’s go back to referencing the tables directly and create the missing index using the feature we mentioned earlier. Just hit the Execute button in the Index creation dialog:
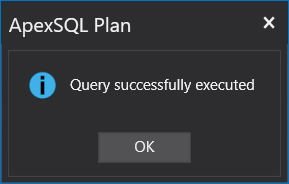
Close the confirmation message by clicking OK:
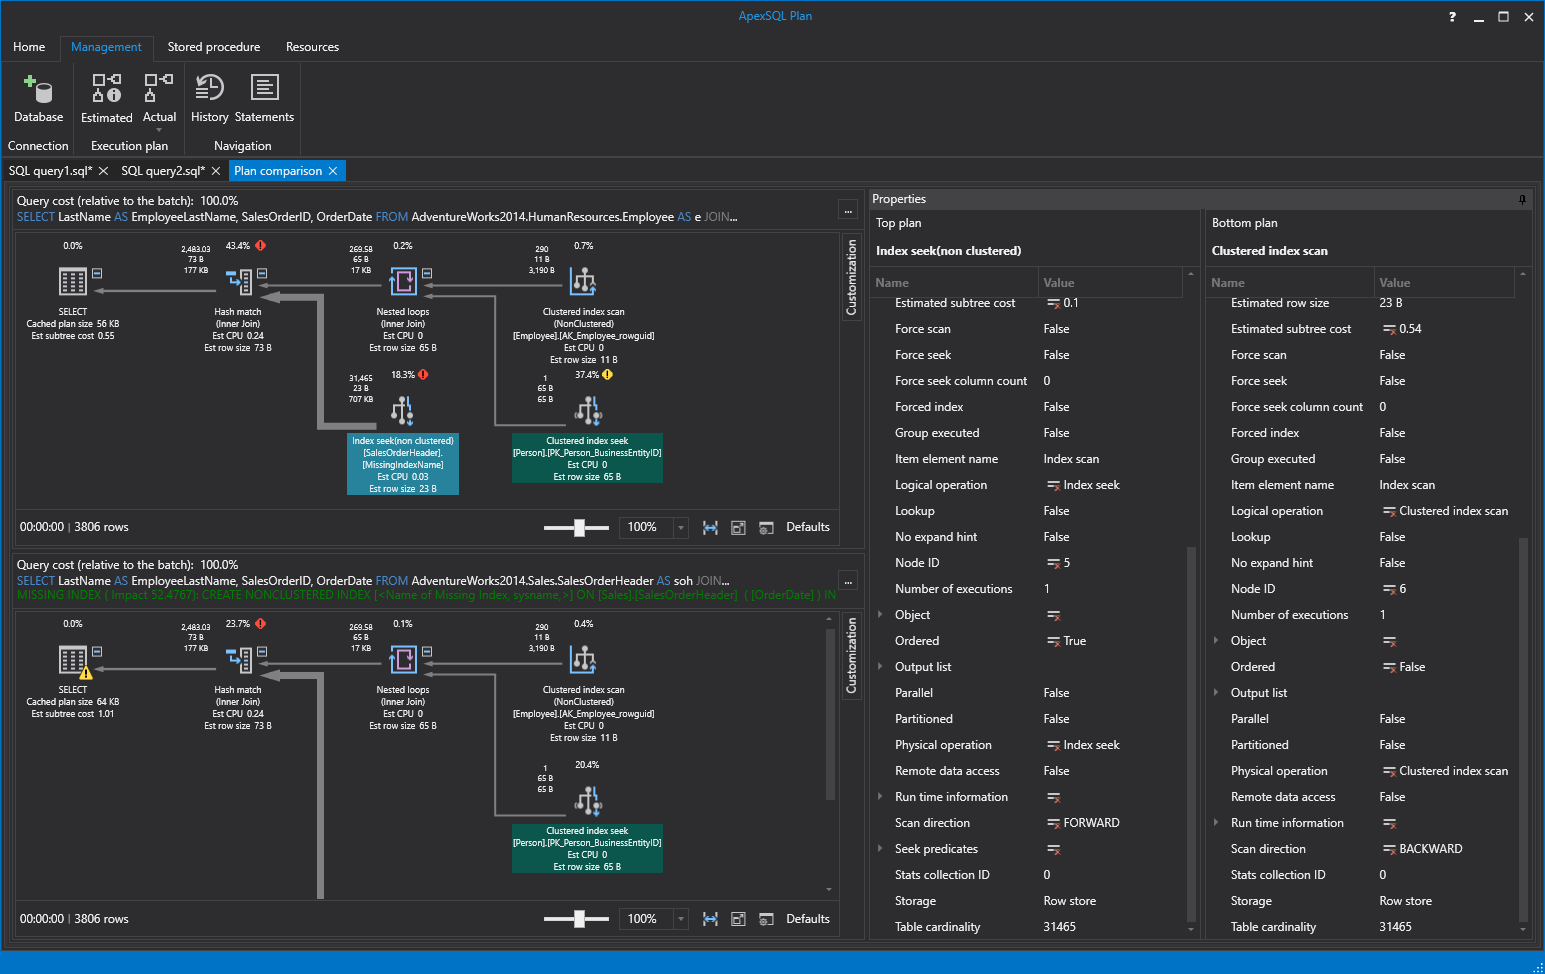
Compare with saved one more time and note the differences in running both queries before/after creating the index. The differences are shown with an (x) icon within the Value column in the Properties pane:
In this particular case, it’s obvious that we went from clustered index scan to non-clustered index seek but more importantly we reduced the total cost of the operator from 53.9% to 18.3%. Feel free to scroll up and down thru the Properties of compared plans as you’ll find all differences and see improvements/deteriorations.
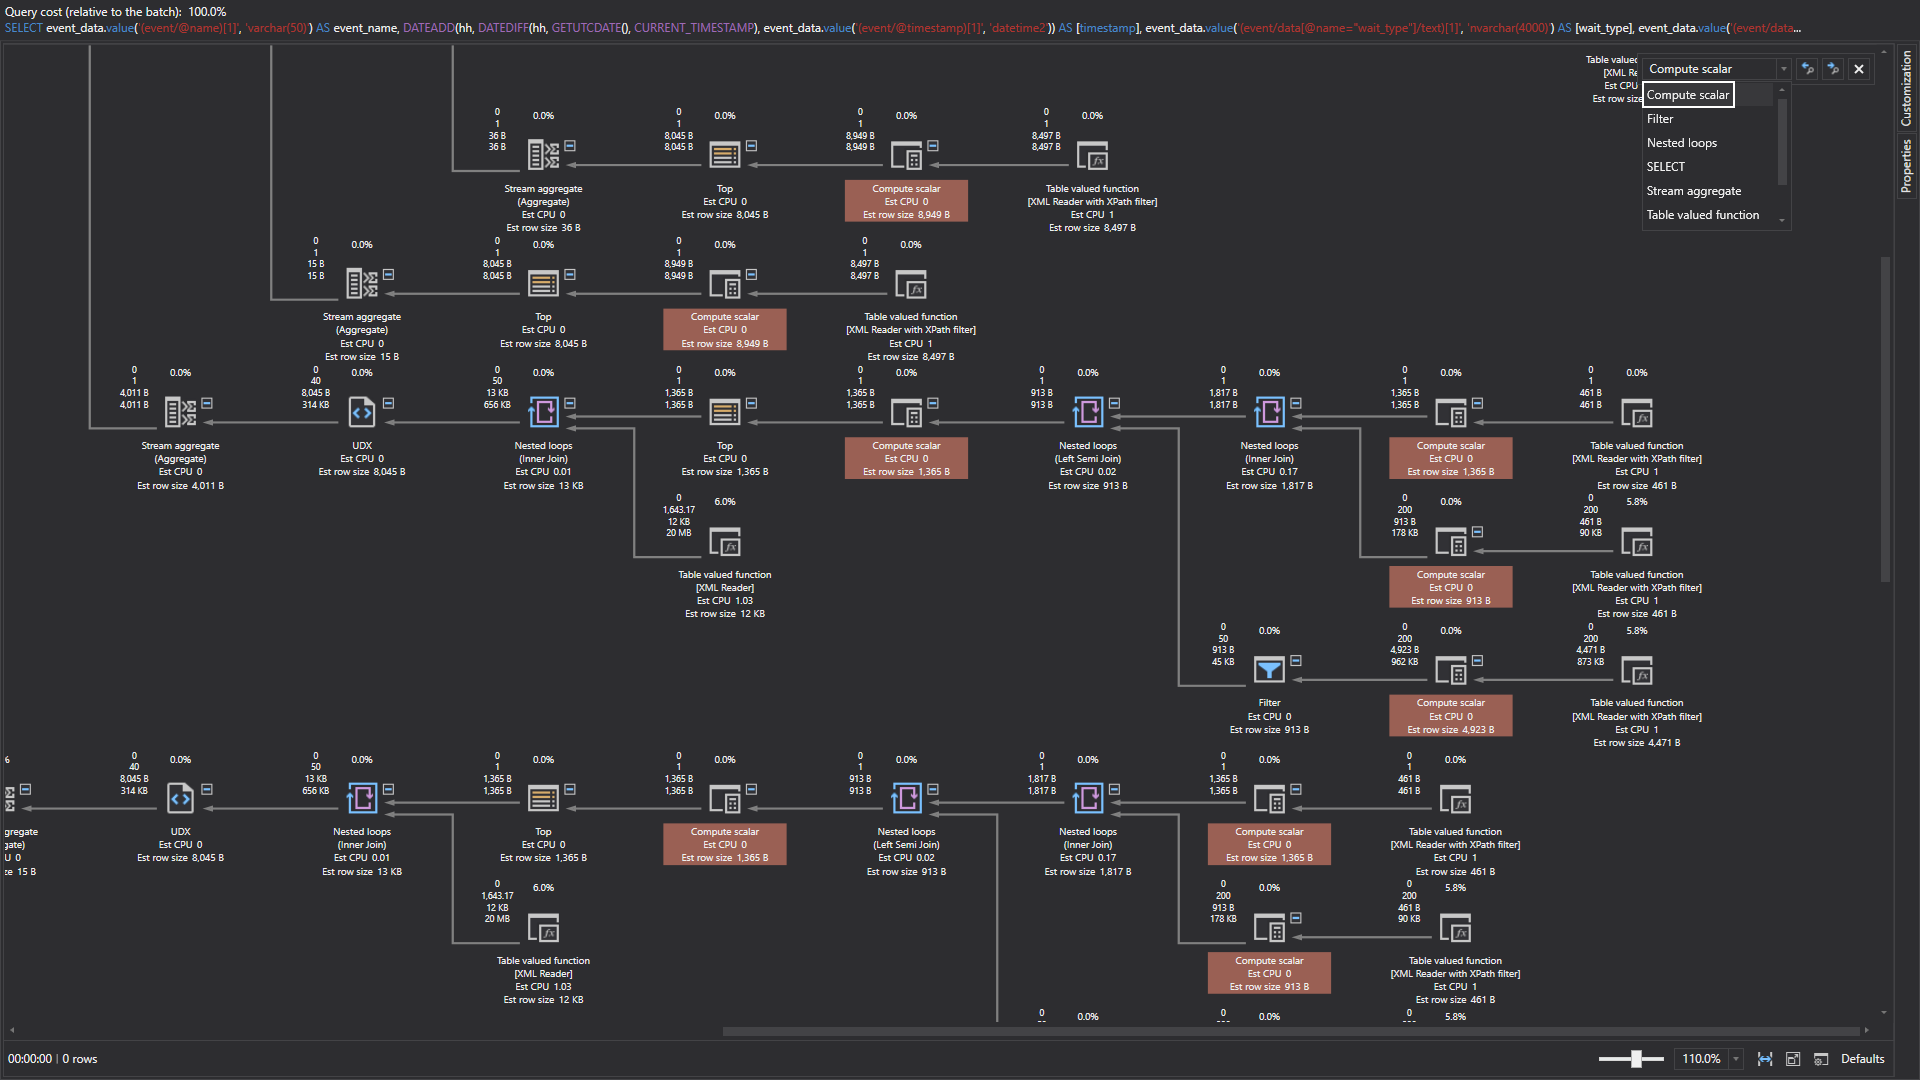
Next, imagine how big/complex SQL execution plans could get. In the real world, there are queries selecting data from multiple tables, having over 100 operators performing all kinds of index scans/seeks, hash matches, nested loops, etc. In such cases, even viewing the SQL execution plan in full screen makes it hard to visualize the whole plan. Luckily, ApexSQL plan can find any node that executed plan contains using the node search feature. Simple use the shortcut Ctrl + F from the keyboard which will open a new sub-window (search box) within the SQL execution plan. From the drop-down box, choose an operator and those will be highlighted in the plan. Use the arrows to move back (Shift + F3) and forward (F3) thru the map from node to node:
List of all the features that a SQL execution plan analysis tool should have is long and mentioning all of them would require a lot more words. Check out the ApexSQL Plan web page for the full overview. To wrap things up, here are a few additional features which stand ApexSQL Plan out from other tools:
- Visual themes to match hosts (automatic host matching)
- 4K/high resolution support
- Microsoft iconography and colors to match host environment
- Azure, Express, Amazon RDS support
July 13, 2018


